SUNPHARMA trade ideas

TrendThe trend has reversed in the last 2 days. Huge bullish move. Today also was more towards bullish. if crossed 61.8% fib should hit the target in a few days.


SUNPHARMA - Long / Short Based on trend and past support/resistance levels
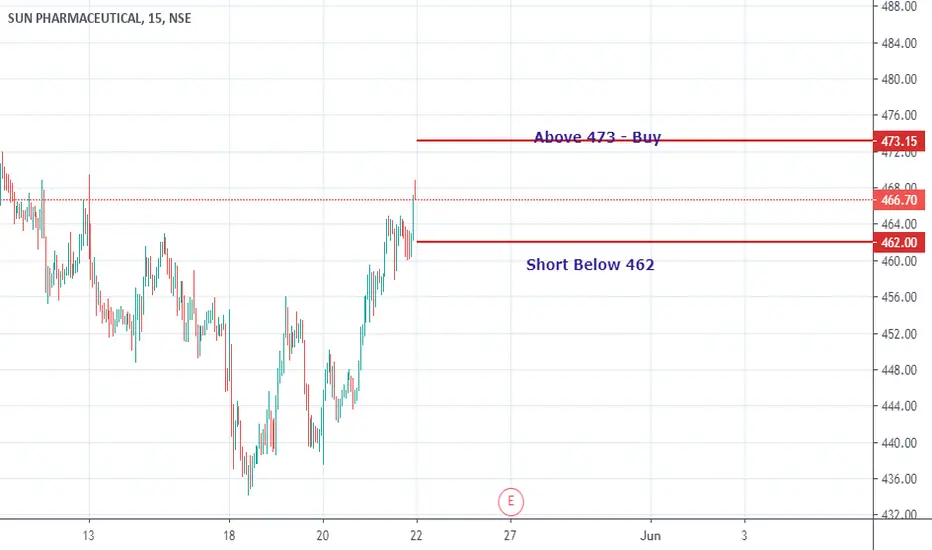
Sunpharma - above 473 - we can go for long with expected levels of 477/484/490
Incase if trend reverse, short below 462 -- with expected levels of 458/453/445/440


sun pharma Sun pharma is consolidating tightly for the last 8 trading days in the Range 470-450 , can see upside in coming days
it has a strong 240 min demand zone 442-433 , view negated if breaks the zone . An upside movement can bee seen Target 490 -500 .

Sunpharma Short below 443#SunPharma has generated sell signal near 457. However 443 is an important support level for the stock. Closing below 443, it can revisit 431/408 levels. Wait for breakdown.


SUNPHARMA TO FALL MOREAfter the strong short bull run sunpharma is now undergoing correction
Expecting it to retrace to the above targets
CCI supports the down move
Place the stoploss above 462


SUN PHARMA | H&S formationThere's a head and shoulders formation on the intraday chart for SUN PHARMA.
Advise caution. Good short opportunity!


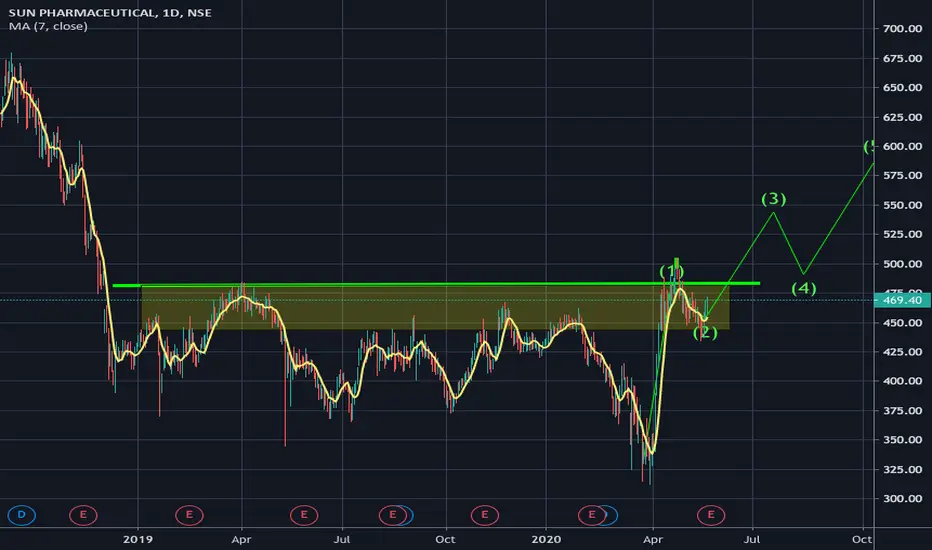
SUNPHARMA AnalysisPossible upside. TP1 is a definite target. TP2 if uptrend is strong with good volume.
-Kautilya.K


Double Bottom Chart Pattern - SUNPHARMAThe Double bottom looks like the letter "W". The twice-touched low is considered a support level.
The advance of the first bottom should be a drop of 10% to 20%, then the second bottom should form within 3% to 4% of the previous low, and volume on the ensuing advance should increase.
The double bottom pattern always follows a major or minor downtrend in a particular security, and signals the reversal and the beginning of a potential uptrend.

SUNPHARMA SHORTHeavy supply above 480 from last few days short.
Short if it breaks 453
Target 440,425
Stoploss : 480
Risk/Reward ::::: 1

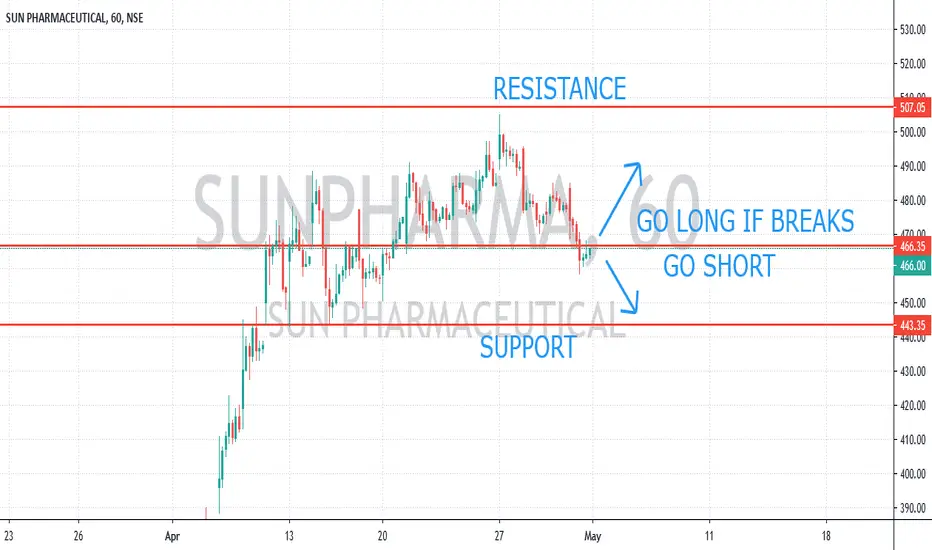
SUNPHARMAStock Is in Support & Resistance,If It Go Above Go For Long Till Resistance If doesn't Go Short Till Support.