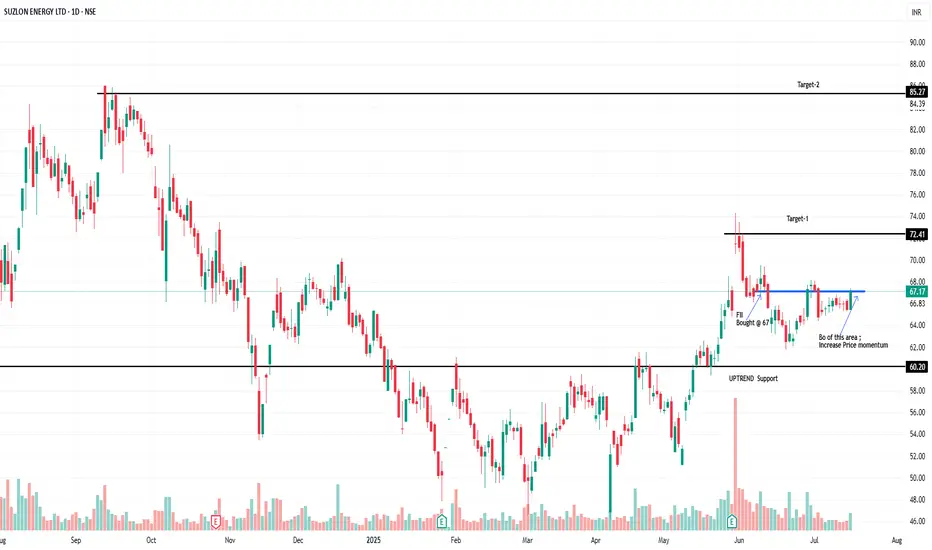
Suzlon Technical AnalysisPrice is currently at area where there was FII bought it earlier in June
-- Break out of current short-Term resistance can give lot of Momentum in price
-- BPB of current Resistance are can give Target-1 and thenTarget-2
SUZLON trade ideas
SUZLONSUZLON
watch above levels. green line is our entry, redline is our SL.
DISCLAIMER : I am NOT a SEBI registered advisor or a financial adviser. All the views are for educational purpose only.
Suzlon Energy: Breakout on the Horizon? Stock Alert for Swing Traders & Investors!
📊 After months of moving sideways, Suzlon has finally reached a critical resistance level at ₹61 – a level it has tested four times (R1 to R4) since January 2025.
🔍 This tight consolidation zone between ₹50 and ₹61 has acted like a pressure cooker – and we all know what happens when pressure builds up too much! 💥
📌 Why this matters:
4x resistance tests = strong breakout potential
Volume surge on recent moves = smart money interest?
Breakout above ₹61 could open gates for a big rally 🚀
💡 What to watch for:
A strong closing above ₹61 with good volume = breakout confirmation
Retest of ₹61 as support = ideal entry for bulls
Target zones = ₹66, ₹70+ in coming weeks (based on past price action)
📣 Are you ready for the move? Or will you watch it from the sidelines? for more info contact me

SUZLON - BEAUTIFUL BREAKOUT OF THE TRENDEverything is pretty much explained in the picture itself.
I am Abhishek Srivastava | SEBI-Certified Research and Equity Derivative Analyst from Delhi with 4+ years of experience.
I focus on simplifying equity markets through technical analysis. On Trading View, I share easy-to-understand insights to help traders and investors make better decisions.
Kindly check my older shared stock results on my profile to make a firm decision to invest in this.
For any query kindly dm.
Thank you and invest wisely.

suzlon next support zone 38.40 to 41.60,Suzlon support zone 38.40 to 41.60, 1st range
and 40 to 33.90, 2nd range buy from bottom

suzlon energy on perfect support for buying 50% gainsuzlon energy on perfect support for buying 50% gain, please trade on own analysis

Suzlon idea on daily time frame Suzlon is near to support 1 can make a good entry either up side or down side.
After budget the share is corrected nearly 42% from its high.
This is just an idea for educational purposes and is not a recommendation as I'm not a SEBI registered personal...
Please do suggest your views on my study...

Suzlon Set to Rise After Strong Earnings: What's Next...?**Q3 Results Live: Suzlon Energy Reports 91% Increase in Net Profit to ₹387 Crore**
- Net profit has risen by 91% year-over-year, reaching ₹387 crore.
- Revenue has also increased by 91% year-over-year, totaling ₹2,969 crore.
- EBITDA has more than doubled, now standing at ₹500 crore.
- EBITDA margin is recorded at 16.8%.
At present, Suzlon is positioned at a crucial support level of 50 on the weekly timeframe, indicating possible price stabilization. This level has historically served as a strong point of interest for buyers. Observing the trendline, it's essential to monitor for a potential breakout from the current downtrend. If the price decisively surpasses this bearish trend, it may signal an opportune moment to initiate a long position or consider buying, reflecting a shift in market sentiment towards a bullish outlook. It’s advisable to look for additional confirmation through volume analysis or other technical indicators to strengthen the decision-making process.

Penny Stock: A small allocationWith falling markets stock keeps falling. If it falls below 40, think of opportunity to buy small qty as a small bet that you are willing to lose.

Suzlon Almost at 52 week low areaSuzlon looking good to long here price is trading at 52 week low area of 50, now at cmp is 56 can long here if comes down bit one can add more and hold for the targets of 70,80 and 90 even 100 long term hold.
Educational purpose only do your own research before taking entries.

Suzlon looking weakOn daily frame, here we can notice that suzlon has breakdown an important level of 65.75.
From here we can expect targets of 56.50, 53 & 49.50 only if big players don't play any game. Technically we can expect these targets, rest depends upon promoters & big players.

SUZLON : Eyeing a Wave 5 RallyDetailed Chart Analysis: SUZLON ENERGY (Daily Timeframe)
Technical Observations:
Pattern Identified: The stock is completing a Wave 4 correction in an Elliott Wave structure, consolidating between ₹56 - ₹67 (Fibonacci retracement zone).
Price Behavior: A bounce from this zone suggests the possibility of resuming the upward trend into Wave 5 .
Buy Zone: ₹56 to ₹67 (Low-risk entry for a Wave 5 rally).
Targets:
First Target: ₹79 (Aligned with prior swing highs and resistance levels).
Second Target: ₹90 - ₹94 (Based on Fibonacci projection for Wave 5).
Stop Loss: Below ₹53.71 (Placing it slightly below Wave 4 support zone).
Learning Points:
Wave 4 Correction: Often acts as a consolidation phase before the continuation of the broader trend.
Trend Continuation: A bounce from the Wave 4 zone confirms potential upside.
Risk Mitigation: A stop loss below ₹53.71 ensures controlled risk in case of failure.
Reason for Action:
Wave 4 Zone Validation: Consolidation around ₹56 signals accumulation and potential bullish breakout.
Target Rationale: Targets are aligned with Fibonacci projections for Wave 5.
Stop Loss Importance: It minimizes risk while allowing participation in the uptrend.
Disclaimer:
I am not a SEBI-registered analyst. All analyses are for educational purposes only. Please consult your financial advisor before making any trading or investment decisions.

SULZON ENERGY LTD S/R 22/11/24Support and Resistance Levels:
Support Levels: These are price points (green line/shade) where a downward trend may be halted due to a concentration of buying interest. Imagine them as a safety net where buyers step in, preventing further decline.
Resistance Levels: Conversely, resistance levels (red line/shade) are where upward trends might stall due to increased selling interest. They act like a ceiling where sellers come in to push prices down.
Breakouts:
Bullish Breakout: When the price moves above resistance, it often indicates strong buying interest and the potential for a continued uptrend. Traders may view this as a signal to buy or hold.
Bearish Breakout: When the price falls below support, it can signal strong selling interest and the potential for a continued downtrend. Traders might see this as a cue to sell or avoid buying.
20 EMA (Exponential Moving Average):
Above 20 EMA(50 EMA): If the stock price is above the 20 EMA, it suggests a potential uptrend or bullish momentum.
Below 20 EMA: If the stock price is below the 20 EMA, it indicates a potential downtrend or bearish momentum.
Trendline: A trendline is a straight line drawn on a chart to represent the general direction of a data point set.
Uptrend Line: Drawn by connecting the lows in an upward trend. Indicates that the price is moving higher over time. Acts as a support level, where prices tend to bounce upward.
Downtrend Line: Drawn by connecting the highs in a downward trend. Indicates that the price is moving lower over time. It acts as a resistance level, where prices tend to drop.
RSI: RSI readings greater than the 70 level are overbought territory, and RSI readings lower than the 30 level are considered oversold territory.
Combining RSI with Support and Resistance:
Support Level: This is a price level where a stock tends to find buying interest, preventing it from falling further. If RSI is showing an oversold condition (below 30) and the price is near or at a strong support level, it could be a good buy signal.
Resistance Level: This is a price level where a stock tends to find selling interest, preventing it from rising further. If RSI is showing an overbought condition (above 70) and the price is near or at a strong resistance level, it could be a signal to sell or short the asset.
Disclaimer:
I am not a SEBI registered. The information provided here is for learning purposes only and should not be interpreted as financial advice. Consider the broader market context and consult with a qualified financial advisor before making investment decisions.

SUZLON: 27% Gains in 42 Days!SUZLON ENERGY Stock - Short Trade
Trade Summary:
The 4-hour chart of Suzlon Energy showcases a textbook short trade setup, with Targets 1, 2, and 3 already achieved using the Risological swing trading indicator.
This trade has delivered a remarkable 27% profit in just 42 days since the entry.
Target 4 is now firmly in sight, with strong bearish momentum supporting the trend.
Trade Highlights:
Entry Price: ₹76.90
Stop Loss: ₹81.47 (strategic risk placement)
Profit Targets :
TP1: ₹71.26 ✅
TP2: ₹62.12 ✅
TP3: ₹52.98 ✅
TP4: ₹47.33 (nearing completion)
Analysis:
Bearish Momentum: The price remains under the influence of a downsloping Risological Swing Trader indicator , confirming sustained selling pressure.
Steady Decline: The stock has consistently formed lower highs and lower lows, with the red EMA line reinforcing the downtrend.
Next Steps:
For those already in the trade, tighten trailing stops to safeguard profits while giving the trade room to hit TP4.
For new entrants, consider waiting for a retracement before entering to manage risk effectively.
Patience is key—TP4 is well within reach! 🧘♂️📉

suzlon energysuzlon energy makes cup and handle pattern on weekly chart with emerging volume ,so it can reach 112 to 117 in short to med term

SUZLON Swing Long TradeEnter with Limit order placed at - 77
Target with Risk to reward 1:2 is 91.4
Stoploss only when 1 day candle closes below the price - 65.6
Note: This is not any financial advice, this is for education purpose only

"U" Shape.14 Years Bottom Shape and pattern to pattern chart breakout in 1Month TF.
it in half pathway to complete "U" Shape pattern.
This is only my viewe of technical analysis,..

Suzlon Energy: Navigating Key Resistance and Support ZonesSuzlon Energy: Navigating Key Resistance and Support Zones
NSE:SUZLON is showing notable technical levels that could determine its next move:
Resistance Zones: 86 / 78 – These levels present strong selling pressure, and failure to break above could lead to potential retracements. Keep an eye on volume at these levels for any breakout signals.
Support Zones: 71 / 66 – These areas act as crucial support. A breach here might trigger further downside momentum, possibly leading to a more significant correction.
The stock’s behavior near these zones will likely dictate the short-term trend. Traders should closely monitor for any patterns that indicate potential reversals or continuations.
Disclaimer: I am not a SEBI-registered Research Analyst. This is purely for educational purposes. Please perform your own due diligence and consult a financial expert before taking any trade.

Suzlon - Short term prospectsReversing Trend: Suzlon indicates a potential trend reversal.
Volume Increase: Noticeable increase in volume at the support level suggests buying interest.
Support Level Holding: The stock has successfully held above the 4-hour (4H) support level during market correction.
Possible Retest: There may be a retest at the 72-73 levels before the stock begins its upward move, providing a potential buying opportunity.
Targets:
Initial Target: A short-term target of 78, with anticipation of upward movement after the retest.
Extended Target: If the stock sustains or surpasses the 78 level, the next target would be in the range of 81-82.
Disclaimer
This chart is for study purposes only and not a recommendation to buy or sell Suzlon stock. Please conduct your own research and consult with a financial advisor before making any trading decisions.

SUZLON Stock 780% Profit So Far! MASSIVE!What a beauty.
The only problem is, people have less patience to trade or invest in equity.
People with patience and big money always trade in Equity.
Thank you SUZLON! This was my under dog in 2023, but holding for 1+ years really paid off.
Had bought around 9-10 average price.
Nice catch.

Suzlon energy at key resistance.Suzlon energy at key resistance, price can plummit to down side, trade with proper risk management

SUZLON Suzlon is in the process of forming a descending triangle pattern, and we are eagerly anticipating a breakout.

Suzlon turning bullish to bearish?Suzlon forming Crab pattern, Current rally may extend upto 60 & then it may follow reversal as per target. Target1: 45/40, Target2: 33/27/24.
