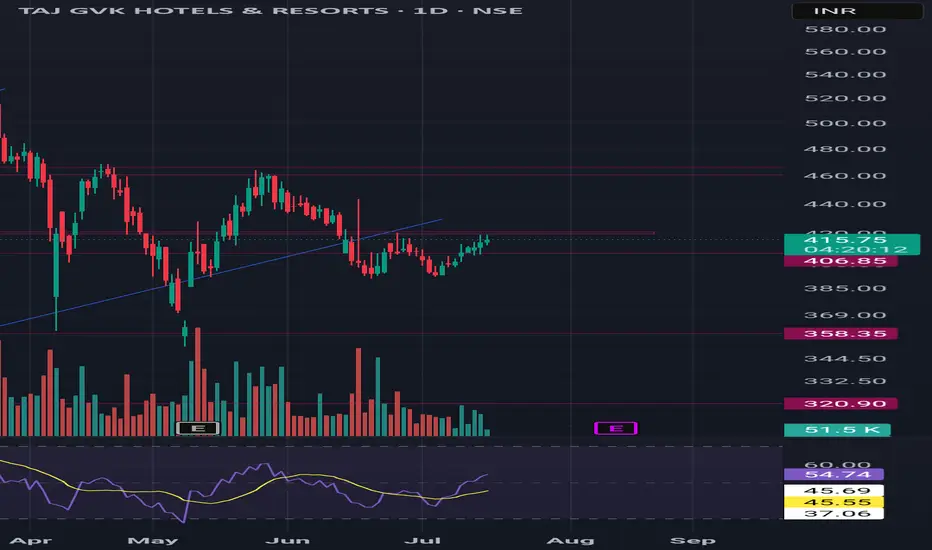
TAJGVK , 1D , Bullish as this stock given breakout from the Triangle Pattern with Good Volume , this stock is ready to Enter .
put SL below its swing low
follow more swing ideas like this .
TAJGVK trade ideas

Tajgvk on it's way to breakout Taj gvk foaming strong chart with the strong support of rsi . Made w pattern in the chart if breakout made then we see 8-10% upside. We buy it only on closing basis.
Buy taj gvk above 422 colse
Target 436 460 466
Sl 390
Time 4-5 weeks after breakout
"Taj GVK Hotels & Resorts: Bullish Breakout with INR 1325 TargetTechnical Analysis
The chart shows a clear inverted Head and Shoulders / ascending triangle pattern. The breakout above the neckline confirms the pattern, suggesting a potential upward move. The target price of INR 1325 is derived by measuring the height from the head to the neckline and projecting it upwards from the breakout point. Additionally, the stock is trading above key moving averages, confirming bullish momentum.
Fundamental Analysis
Taj GVK Hotels & Resorts has demonstrated strong financial performance:
Revenue Growth: For H1 FY25, revenue grew by 10.8% YoY to ₹202.07 crore. EBITDA margins also improved, reflecting operational efficiency.
Profitability: PAT for Q2 FY25 rose by 76% YoY, indicating robust profitability.
Valuation Metrics: The stock is trading at a P/E ratio of 27.56, which is lower than the sector average of 85.06, suggesting relative undervaluation within its sector.
Expansion Plans: The company is constructing a new 253-room Taj hotel in Bengaluru, expected to open in FY26. This expansion could enhance revenue streams in the long term.
Cash Flow: Positive cash flow from operations (₹123.79 crore in FY24) indicates strong liquidity and financial health.
SWOT Analysis
Strengths:
Strong Brand and Market Position: Taj GVK benefits from its association with the Taj Group, a leading name in hospitality.
Consistent Financial Performance: Revenue and profit growth highlight operational efficiency and demand resilience.
Expansion Strategy: New projects like the Bengaluru hotel indicate forward-looking growth plans.
Weaknesses:
High Valuation Metrics: A P/B ratio of 5.41 and P/S ratio of 6.74 indicate that the stock is trading at a premium compared to intrinsic value.
Dividend Yield: At just 0.30%, the dividend yield is relatively low, which might not appeal to income-focused investors.
Opportunities:
Hospitality Sector Growth: The Indian hospitality industry is witnessing robust demand due to increasing tourism and business travel.
Upcoming Properties: The new hotel in Bengaluru could significantly boost revenues post-FY26.
Digital Transformation: Leveraging technology for better customer experiences can enhance brand loyalty.
Threats:
Economic Cycles: Hospitality demand is sensitive to economic downturns, which could impact revenue.
Competition: Intense competition from other luxury hotel chains may pressure margins.
Regulatory Risks: Changes in taxation or environmental regulations could increase costs.
Conclusion
The technical analysis suggests a bullish outlook with a target of INR 1325 based on the inverted Head and Shoulders pattern. Fundamentally, Taj GVK is well-positioned for growth due to its strong financials and expansion plans but faces valuation concerns and external threats like competition and economic cycles. Investors should weigh these factors before making decisions.

Channel BO - TAJGVKThere is chance for triangle BO, but need careful about these kind of BO 70% will fail, but if it continues without failing 2x even 3x price advantage is possible. So better we could bed on this BO.
Already All time high BO happened and retested and breaking again. If i want to tell this in AL Brook style, It is failure of BO failure.
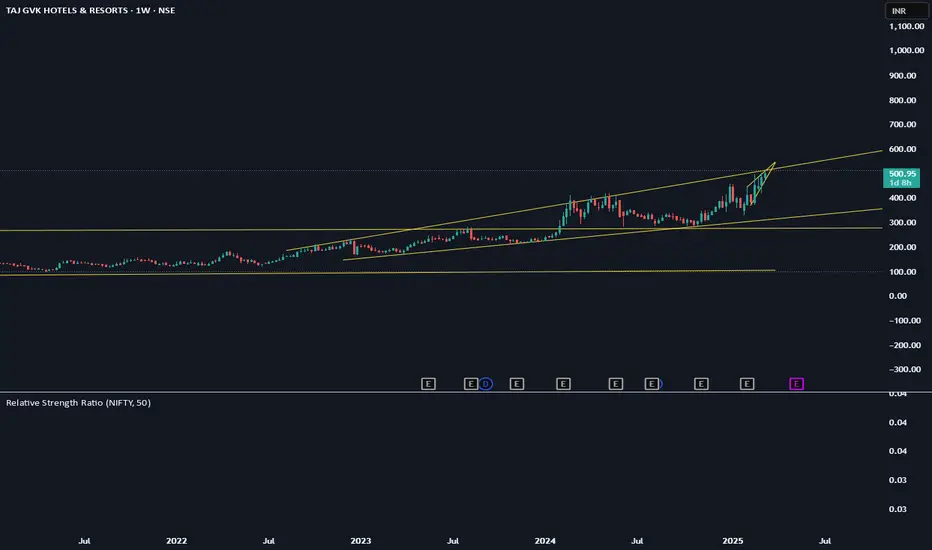

TAJ GVK HOTEL BREAKOUT (WEEKLY)Its a 18 year breakout stock set up.
after a years long breakout setup taj gvk has retested the previous levels and gives fresh breakout on weekly chart.
video explanation

Amazing breakout on WEEKLY Timeframe - TAJGVKCheckout an amazing breakout happened in the stock in Weekly timeframe, macroscopically seen in Daily timeframe. Having a great favor that the stock might be bullish expecting a staggering returns of minimum 25% TGT. IMPORTANT BREAKOUT LEVELS ARE ALWAYS RESPECTED!
NOTE for learners: Place the breakout levels as per the chart shared and track it yourself to get amazed!!
#No complicated chart patterns
#No big big indicators
#No Excel sheet or number magics
TRADE IDEA: WAIT FOR THE STOCK TO BREAKOUT IN WEEKLY TIMEFRAME ABOVE THIS LEVEL.
Checkout an amazing breakout happened in the stock in Weekly timeframe.
Breakouts happening in longer timeframe is way more powerful than the breakouts seen in Daily timeframe. You can blindly invest once the weekly candle closes above the breakout line and stay invested forever. Also these stocks breakouts are lifelong predictions, it means technically these breakouts happen giving more returns in the longer runs. Hence, even when the scrip makes a loss of 10% / 20% / 30% / 50%, the stock will regain and turn around. Once they again enter the same breakout level, they will flyyyyyyyyyyyy like a ROCKET if held in the portfolio in the longer run.
Time makes money, GREEDY & EGO will not make money.
Also, magically these breakouts tend to prove that the companies turn around and fundamentally becoming strong. Also the magic happens when more diversification is done in various sectors under various scripts with equal money invested in each N500 scripts.
The real deal is when to purchase and where to purchase the stock. That is where Breakout study comes into play.
LET'S PUMP IN SOME MONEY AND REVOLUTIONIZE THE NATION'S ECONOMY!


TAJ GVK : VCP Breakout RetestTAJ GVK is a beautiful example of Volume Contraction Pattern inside a Monthly Ascending Traingle formation. The breakout of the monthly chart of its ALL TIME HIGH done with good volume, Currently Retested.

TAJ GVK HOTELS - READY FOR BREAKOUT SUPPLY ZONE & 4 MONTHS BREAKOUT
Breakout point - 415
ENTRY - 415
SL - 370
TARGETS - 500
Disclaimer - All information on this page is for educational purposes only,
we are not SEBI Registered, Please consult a SEBI registered financial advisor for your financial matters before investing And taking any decision. We are not responsible for any profit/loss you made.

TAJGVKMultiple Breakouts.
Consolidation followed by Huge Volumes.
Looks so Good on Chart.
Above all EMA.
Good for Short term.
Do Like ,Comment , Follow for regular Updates...
Keep Learning ,Keep Earning...
Disclaimer : This is not a Buy or Sell recommendation. I am not SEBI Registered. Please consult your financial advisor before making any investments . This is for Educational purpose only.

Taj GVK (Daily)Taj GVK (Daily)
CMP 406
All time high breakout with Volume
Huge Volume spurt
Stock in Uptrend


Swing trading: Taj hotelFind all levels are mentioned. Do accordingly. Stoploss is much below,so trade wisely. But after breakout of 425 ...next target 500. If it declared good quarterly result.

TAJ GVK HOTELS Trading strategy TAJ GVK HOTELS - 1D. NSE: This indicates the stock being charted is Taj GVK Hotels Ltd., on a 1-day timeframe, and the data is from the National Stock Exchange of India (NSE).
Price: The vertical axis represents the stock's price.
Time: The horizontal axis represents time. Since it's a 1-day chart, it likely covers the current trading day.
Other visible elements:
Moving Averages: There are two lines plotted on the chart, likely moving averages. Moving averages smooth out price fluctuations to show the general trend. However, the specific moving averages used here aren't labeled.
Supertrend: Another line plotted on the chart, likely a Supertrend indicator, used to identify potential entry and exit points in a trend.
RSI: The value 56.56 near the bottom might be the Relative Strength Index (RSI), used to measure price momentum. A reading above 70 is considered overbought, and below 30 is oversold.
Overall, the chart suggests a recent price increase for Taj GVK Hotels Ltd. However, to make informed investment decisions, you should consider this along with other factors. Here are some additional things to keep in mind:
Short time frame: This chart only shows a one-day timeframe. It's wise to look at longer timeframes to understand the stock's broader price movement.
Technical indicators: While technical indicators can be helpful, they don't guarantee future performance. The price can move against what the indicators suggest.
Company fundamentals: Research the company's financial health, future prospects, and industry trends before making investment decisions.
Remember, this is a simplified explanation of a complex chart. It's crucial to do your own research and understand the risks involved before investing in any stock.

TAJGVK QUARTERLY CHARTTAJGVK QUARTERLY CHART
Cmp 272.60 Ellipse breakout @ 264 MOB @ 390-410 Support @ 210
This stock has witnessed an ellipse breakout @ 264 levels, MOB for the pattern is seen @ 390-410 levels.
Its only an observation & not any suggestion.

TAJGVKThese are swing ideas which you can add your watchlist and analysis for yourself !
Keep on your radar!

TAJGVK Showing good strengthHotel industry is doing good in general. Other hotel stocks are flying. This stock journey is yet to start. I am expecting 20% to 25% return from this stock. After that I will trail.

TAJGVK BEAT STOCK MAKING HEAD AND SHOULDER TAJGVK given Breakout and taking Reversal from 4hr area it may give short time Target 285 and long time Target 410 Stock has potential of 60% upside

Breakout in tajgvk hotelBuy tajgvk hotel at 245 if it sustain at that level thn our target is 257 270 275
Sl 220

TAJGVK Ascending base with good volume retarcement on low selling volume once the price breakout from this area of resistance good levels can be seen

Update on TAJ GVK HOTELSHi, One my follower asked me to post updated levels of this stock on charts. Hence posting my view on this stock technically. Please consider this for education purpose

Trendline BreakoutPlease look into the chart for a detailed understanding.
Consider these for short-term & swing trades with 2% profit.
For BTST trades consider booking
target for 1% - 2%
For long-term trades look out for resistance drawn above closing.
Please consider these ideas for educational purpose
