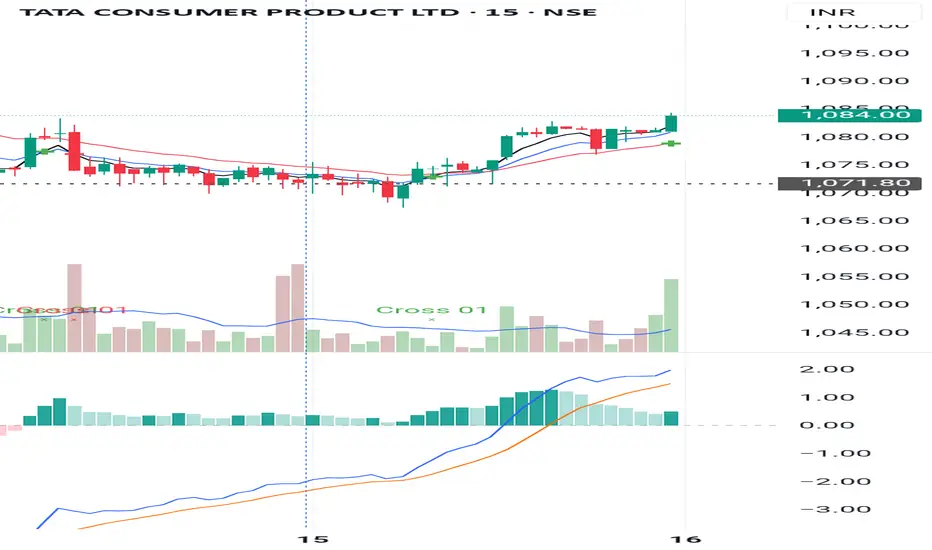
Review and plan for 24th July 2025Nifty future and banknifty future analysis and intraday plan.
Quarterly results.
This video is for information/education purpose only. you are 100% responsible for any actions you take by reading/viewing this post.
please consult your financial advisor before taking any action.
----Vinaykumar hiremath, CMT
TATACONSUM trade ideas

Moving average has only one principle, solve the problem, earn mMoving average has only one principle, solve the problem, earn money,
NSE:TATACONSUM CHART PATTERN ANALYSIS🔍 Chart Pattern Analysis:
Pattern Identified: Bullish Flag
Pole: The sharp move up from March to early May.
Flag: The downward-sloping parallel channel (purple lines) forming from mid-May to late June.
Breakout Zone: Price has approached the upper boundary of the flag, suggesting a potential breakout.
📊 Volume Analysis:
Volume increased during the flagpole (strong buying).
Volume decreased during consolidation in the flag (healthy sign for a flag pattern).
A volume spike during breakout (not yet seen) would confirm bullish momentum.
📈 Price Projection:
Based on the flagpole height:
Pole height: Approx. ₹1060 to ₹1245 = ₹185
Breakout level: Around ₹1150
Target: ₹1150 + ₹185 = ₹1335
Your chart already shows a projected upward move towards the ₹1,350–₹1,400 region, aligning with this measured move.
✅ Bullish Confirmation Signals:
Price nearing breakout above the flag.
Strong trend from earlier (bullish continuation expected).
Breakout may lead to quick momentum-driven gains.
⚠️ Risks & Invalidations:
Breakdown below flag support (~₹1,080) invalidates the pattern.
Bearish candle near breakout zone without volume can indicate a fakeout.
Broader market weakness may weigh on follow-through.
📝 Conclusion:
This is a bullish continuation pattern (flag).
A breakout above ₹1,160 with volume confirms an upward target of ₹1,330–1,400.
Ideal entry: On breakout with volume.
Stop-loss: Below ₹1,080 (flag low).
Let me know if you’d like a Pine Script for this pattern or volume-based alerts for breakout confirmation.

Tata Consumer product LTD- For swing tradeToday price has formed a good bullish Spining Top Marubozu candle with a good volume .
Price is also in its very important support level.
We can go for long trade if price closes above today high which is 1091.
Our 1st target will be 1130 and 2nd target will be 1170.
We can take a stop loss of 1060 (30 points).

TATA CONSUMER Chart Patterns Identified:
Triangle Pattern (2021–2022)
A consolidation phase followed by a breakout.
Rising Wedge (2022)
A bearish reversal pattern, which led to a breakdown.
Falling Wedge (Late 2022)
A bullish reversal pattern that resulted in an upward breakout.
Double Top Pattern (2024)
Top 1 & Top 2 indicate a potential bearish reversal.
Breakdown from neckline suggests a bearish target around ₹800.
Technical Indicators:
MACD (Moving Average Convergence Divergence):
MACD line (blue) is above the signal line (orange), indicating bullish momentum.
Positive histogram bars further support bullishness.
RSI (Relative Strength Index):
RSI is currently around 60.60, suggesting moderate strength.
It's not in the overbought zone (>70), indicating more room for upside.
EMA (10-Week):
Current price is above the 10-week EMA (₹1107.34), confirming short-term bullishness.
Volume:
Recent candles show moderate volume, with no extreme spikes. Volume confirmation of breakouts is modest.
Conclusion:
The stock has shown a bullish breakout from a falling wedge and is trading above key moving averages.
However, the double top formation from 2024 indicates a potential bearish target if support levels are breached.
RSI and MACD support the current bullish move, but caution is advised around resistance zones near ₹1200.

Educational Video: How Technical Analysis worksThe chart is explained in the video and we can see how you can get an Alpha over the market by knowing when to invest in a stock. Selecting fundamentally strong company is very important but why investing in a Fundamentally strong company when it has a technical breakout can give you a better yield on your investment is explained in the video.
Disclaimer: This is not a recommendation to buy Tata Consumer Product stock but we are using it as an illustration to understand what Technical analysis is and how it works.
The above information is provided for educational purpose, analysis and paper trading only. Please don't treat this as a buy or sell recommendation for the stock or index. The Techno-Funda analysis is based on data that is more than 3 months old. Supports and Resistances are determined by historic past peaks and Valley in the chart. Many other indicators and patterns like EMA, RSI, MACD, Volumes, Fibonacci, parallel channel etc. use historic data which is 3 months or older cyclical points. There is no guarantee they will work in future as markets are highly volatile and swings in prices are also due to macro and micro factors based on actions taken by the company as well as region and global events. Equity investment is subject to risks. I or my clients or family members might have positions in the stocks that we mention in our educational posts. We will not be responsible for any Profit or loss that may occur due to any financial decision taken based on any data provided in this message. Do consult your investment advisor before taking any financial decisions. Stop losses should be an important part of any investment in equity.

Tata Consumer Products Ltd a bearish harmonic Gartley pattern Tata Consumer Products Ltd has formed a **bearish harmonic Gartley pattern, completing at point D near the 1.395 Fibonacci extension—typically a reversal zone. RSI is near overbought, suggesting caution. Based on this technical setup, the stock may face **selling pressure**, making it a sell recommendation with a target of ₹1,040 and a stop loss at ₹1,135. If the price breaks above ₹1,135 with strong volume, trend bias can shift bullish, but currently, it's best viewed with a short-term bearish outlook.
for educational purposes only

Tata consumer products ABCD pattern •CMP: ₹1080 | Stop Loss: ₹1040 Target:*1200
DISCLAIMER: I am NOT a SEBI registered advisor or a financial adviser. All the views are for educational purpose only.

#TATA CONSUMER PRODUCT (Demand Zone)TATA Consumer Products (NSE: TATACONSUM) is currently showing a strong demand zone on the daily/weekly chart, indicating a potential reversal area where buyers are likely to step in. The demand zone is identified between ₹910 and ₹875. Traders can look for long opportunities near the demand zone with a stop-loss below the zone. A break below the demand zone, however, could invalidate the setup and lead to further downside.

TataConsumer Analysis 50% achieved(deep dive)Analysing TataConsumer why only 50 % target achieved. This is only for study purpose.

tata consumeras an average rating of outperform and price targets ranging from 970 Indian rupees to 1,315 rupees, according to analysts polled by Capital IQ

Tata Consumer Products - Bearish could touch 650 - 550Tata Consumer products has shown triangle pattern breakdown.
It could reach to 650 - 550 by March 2025.

Stock Analysis – Tata Consumer Products Ltd (TATACONSUM) 📅 Date: January 30, 2025
📊 Timeframe: Daily Chart
📌 Market Snapshot
- Change: +57.95 points (+5.99%)
- Volume: 5.03M (Above 20-day avg: 1.95M)
- Momentum Indicators: RSI breakout
- Candle Pattern: Strong Bullish Candle (forming)
⚡ Levels to Watch
🔴 Resistance Levels (Above Current Price)
🚀 1,047.93 – Immediate resistance
🚀 1,071.22 – Next resistance zone
🚀 1,111.23 – Major resistance
🟢 Support Levels (Below Current Price)
🔻 984.63 – Short-term support
🔻 944.62 – Key support zone
🔻 921.33 – Strong base
🚀 Conclusion
Tata Consumer is showing strong bullish momentum, with a breakout in RSI and a developing strong bullish candle. The significant volume increase suggests strong participation, supporting the possibility of further upward movement. Price action near resistance levels should be watched closely, with key support zones below.
Could Tata Consumer continue its upward momentum and break through resistance levels, or will it face a pullback to test key support zones?

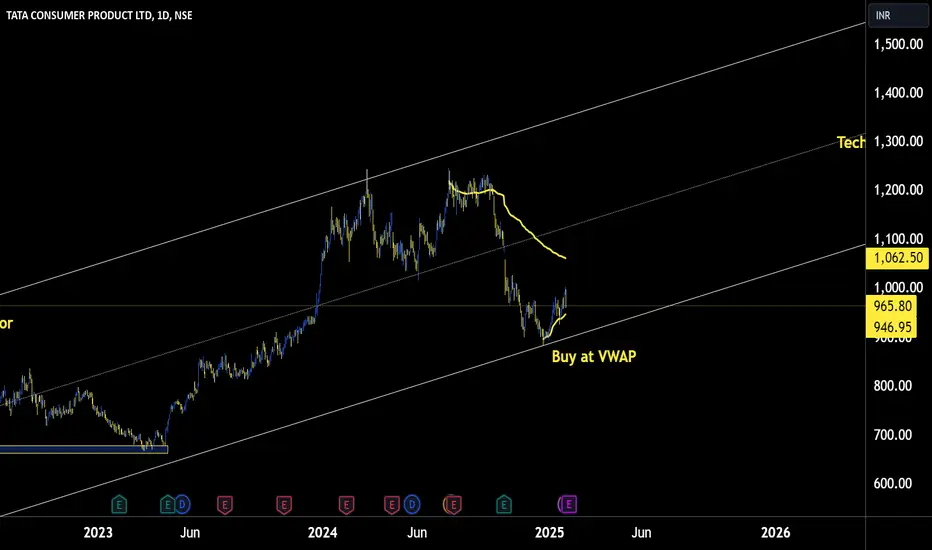
TATA Consumer Buy On VWAP Here’s a detailed profile of **Tata Consumer Products Limited (TCPL)**:
---
### **Company Overview**
**Tata Consumer Products Limited (TCPL)** is a fast-moving consumer goods (FMCG) company under the **Tata Group**, one of India's largest conglomerates. It focuses on delivering high-quality food and beverage products to consumers globally. TCPL was formed after the merger of **Tata Global Beverages** and the **consumer products business of Tata Chemicals** in 2020, marking its evolution into a major FMCG player.
---
### **Key Details**
- **Founded**: 1964 (as Tata Global Beverages, restructured as Tata Consumer Products in 2020)
- **Headquarters**: Mumbai, Maharashtra, India
- **Chairman**: N. Chandrasekaran (Chairman of the Tata Group)
- **Managing Director & CEO**: Sunil D’Souza
- **Stock Listings**: Listed on the **BSE** and **NSE**.
### **Core Business Segments**
1. **Beverages**:
- **Tea**: Market leader with iconic brands like **Tata Tea**, **Tetley**, and **Teapigs**.
- **Coffee**: Includes brands like **Tata Coffee** and **Eight O'Clock Coffee** (USA).
- **Water**: Bottled water under the **Himalayan** and **Tata Copper+** brands.
2. **Foods**:
- **Packaged Foods**: Includes Tata Sampann (pulses, spices, ready-to-cook mixes).
- **Breakfast Cereals**: Joint venture with PepsiCo, marketed under the brand **Tata Soulfull**.
- **Salt**: Market leader with **Tata Salt**, India’s first iodized salt brand.
3. **Ready-to-Drink (RTD)** Products:
- Products like Tata Gluco+ (energy drink) and tea-based beverages.
---
### **Global Presence**
- Operates in **over 40 countries**, including the USA, UK, Canada, Europe, and the Middle East.
- Strong presence in international markets through brands like **Tetley** (UK and Canada) and **Eight O'Clock Coffee** (USA).
---
### **Sustainability and CSR Initiatives**
- Focused on sustainable sourcing of tea, coffee, and other raw materials.
- Actively supports farmer welfare programs.
- Committed to environmental sustainability through water conservation and waste reduction.
- Engages in community initiatives under **Tata Trusts**, focusing on health, education, and livelihood.
---
### **Financial Highlights (2024-25)**
- **Revenue**: Over ₹15,000 crore (approx. USD 1.8 billion)
- **Net Profit**: Steady growth due to its diverse product portfolio and innovation.
- **Market Position**: Among the top FMCG companies in India.
---
### **Strategic Initiatives**
1. **Product Innovation**: Launching healthier and premium product variants like organic teas, Himalayan honey, and ready-to-cook foods.
2. **Digital Transformation**: Strengthening its e-commerce presence.
3. **Acquisitions and Joint Ventures**:
- Acquired **Soulfull**, a health-focused food brand.
- Expanded into premium tea markets through acquisitions.
---
### **Key Brands**
1. **Tata Tea**: India’s largest tea brand with variants like Gold, Premium, and Agni.
2. **Tetley**: A global tea brand with a strong presence in the UK and Canada.
3. **Tata Salt**: “Desh Ka Namak,” India’s leading salt brand.
4. **Tata Sampann**: High-quality pulses, spices, and ready-to-cook products.
5. **Himalayan**: Premium bottled natural mineral water.
6. **Tata Soulfull**: Health-focused cereals, snacks, and millet-based products.
---
### **Achievements**
- Ranked as one of the most trusted FMCG brands in India.
- Consistently recognized for sustainability and responsible business practices.
- Significant contributor to the Tata Group's overall revenue.
Would you like details on a specific product category, market strategy, or financial analysis?
TATA CONSUMAR trading looking bulishTATA CONSUMAR trading looking bulish on 05.01.25 @ 939 bat bullish pattern formation

Tata ConsumerTata Consumer last cl@ 907.25 expected small bounce bk zone 938-920 zone if able to hold further 23.6% can be retested before further correction towards 261%

TATA CONSUMER - Ready to go upEverything is lining up. The levels and divergence.
Can load up Tata Consumer, with a target of around 1018. That is like 10% gain.
I expect it reach this target within this month.
My conviction for this trade is 8/10.

TATA CONSUMER PRODUCTS LTD S/RSupport and Resistance Levels:
Support Levels: These are price points (green line/shade) where a downward trend may be halted due to a concentration of buying interest. Imagine them as a safety net where buyers step in, preventing further decline.
Resistance Levels: Conversely, resistance levels (red line/shade) are where upward trends might stall due to increased selling interest. They act like a ceiling where sellers come in to push prices down.
Breakouts:
Bullish Breakout: When the price moves above resistance, it often indicates strong buying interest and the potential for a continued uptrend. Traders may view this as a signal to buy or hold.
Bearish Breakout: When the price falls below support, it can signal strong selling interest and the potential for a continued downtrend. Traders might see this as a cue to sell or avoid buying.
MA Ribbon (EMA 20, EMA 50, EMA 100, EMA 200) :
Above EMA: If the stock price is above the EMA, it suggests a potential uptrend or bullish momentum.
Below EMA: If the stock price is below the EMA, it indicates a potential downtrend or bearish momentum.
Trendline: A trendline is a straight line drawn on a chart to represent the general direction of a data point set.
Uptrend Line: Drawn by connecting the lows in an upward trend. Indicates that the price is moving higher over time. Acts as a support level, where prices tend to bounce upward.
Downtrend Line: Drawn by connecting the highs in a downward trend. Indicates that the price is moving lower over time. It acts as a resistance level, where prices tend to drop.
Disclaimer:
I am not a SEBI registered. The information provided here is for learning purposes only and should not be interpreted as financial advice. Consider the broader market context and consult with a qualified financial advisor before making investment decisions.

TATA Consumer Products Ltd view for Intraday 25th Nov #TATACONSUTATA Consumer Products Ltd view for Intraday 25th Nov #TATACONSUM
Resistance 950-955. Watching above 957 for upside movement...
Support area 940. Below 948-950 ignoring upside momentum for intraday
Support 940 Watching below 935 for downside movement...
Resistance area 935
Above 948 ignoring downside move for intraday
Charts for Educational purposes only.
Please follow strict stop loss and risk reward if you follow the level.
Thanks,
V Trade Point

SWING PICK -- buy at zonenifty 50 is making small corrections . use this dip as a investing opportunity.
BUY at zone - swing
ENTRY
- lines marked below is potential reversal zone ( PRZ)
- entry is strictly inside the zone
- look for buying confirmation in smaller time frame ( 15 minutes preferred )
EXIT
1. target
- mark fib retracement from C to latest swing low
- TGT 1 - 0.236 fib level
- TGT 2 - 0.382 fib level
- TGT 3 - 0.5 fib level ( preferred target )
2. SL
- candle close below (PRZ)
- if u didn't get confirmation inside the zone , ignore this pick
- if candle close is below zone , this pattern becomes invalid . IGNORE THIS PICK
- RE-ENTRY can be done , if u again get buying confirmation inside the zone

Tata Consumer Product RBTSTata consumer products has given a buy signal according to range bound trading strategy. The lower limit of the range is 1017 and the upper range is 1240. The stock has covered the range 2 times in the past. The company has posted good profit in the latest quarterly results and also showing excellent performance in the past few years. The range is of around 22% and the stochastic indicator also gives a buy signal. Considering it to be a Tata group stock it gives a safety factor to buy the stock for this trade.
Please do your own analysis before investing.
Hope you learned something new from my ideas.
Do like, share and follow me. thank you

Tata Consumer - How the Crash was Predictable Despite ResultsTata Consumer Products - Monthly Vs Weekly Comparison
1. On Monthly - the price formed Double Top pattern at 1,235 level on Sep 2024 and started falling 1.5 months ago. The Neckline is 1,017 level and when it breaks below - it will go down to 865, 698 levels
2. On Weekly - the price once again formed Double Top pattern at 1,222 level on 16th Sep and started falling for 5 Weeks already before today and has a target of 1,017 (which COMPLETED today)
One basic / Logical Question - When the price forms Bearish Patterns back-to-back on Multiple Timeframe Charts - How do you even expect the Results (Positive or Negative) to come and save it ????
And Watch today (Oct 21) - the price opened Gap Down - right below the Monthly Double Top Pattern's Neckline (at Candle Body Level) at 1,047 and took the hard Resistance and fell down -8.5% Intraday
But despite the fall - what saved it from Crashing further to LC or ending below -8% ? the same Monthly Pattern's Double Top Neckline (at Wick Level - 1,017)
Now the price is sandwiched between Wick & Candle Levels of Double Top Neckline
Now - Let's review the same situation from a different Source of Truth. A Comparison of Nifty_Tata_25 Index, Nifty FMCG Index
1. Nifty_Tata_25 index is going thru a Falling Parallel Channel and it ended up right below Resistance yesterday. So Obviously TATA Stocks were set to fall today - but Which one of those ? Today there were multiple Tata Stocks disclosing their Quarterly Results. Some Strong, Some Good, Some Weak - but net result the overall Tata Group stock had to go down - That's the destiny
2. Nifty FMCG Index - the price is again going thru Falling Parallel Channel since Sep 26 and today it opened right at the support level of 60,840 and within few mins it crashed below.
Now that FMCG sector is crashing and Nifty_Tata_25 Index has to Fall - which of the 22 Tata Group stocks will take the Brunt of the Fall ???? - Simple - One and Only Tata Consumer Products
Todays' Tata Group Performance
1. Tejasnet +11%
2. Tata Chemicals +9%
3. Tata Investment +3.3%
4. IHCL (Hotels) +3%
These are the best performers today - and all 4 belong to 4 different sectors. Now let's look at the worst performers of Tata Group
1. Tata Consumer -7%
2. TRF -4.2%
3. Rallis -3.5%
4. Voltas -2.5%
Again - these 4 also belong to 4 different sectors and these 4 sectors are different from the best performing 4 sectors.
So, When Tata Group Index HAD TO FALL - its Obvious that Tata Consumer is the Only One to Take the Worst Hit Logically. Makes Sense ????
----------------------------------------------------------------------------------------------------
Now Next Steps.
1. Nifty Tata Index - ended right at support level
2. Tata Consumer - took support of the Falling Parallel Channel bottom and bounced from -8.5% to -7% (Blue Arrow)
So, its clear that Tata Consumer will Rise tomorrow.....But the rise would NOT be enough for Bullish Reversal - Why ? read below
As you can see on the Weekly Chart, the Double Top on Weekly's target is already achieved and hence the fall stopped temporarily, but the target of Monthly Double Top is 865 and 698.
So, tomorrow when the price rises, it would take a resistance from 1,050 levels again and go sideways for few days and then fall below to 865
Read the Blue Path which explains the extrapolated path it would take to fall down to 865 and even to 698 if needed

TATA Consumer Product ltd view for Intraday 14th October #TATACOTATA Consumer Product ltd view for Intraday 14th October #TATACONSUM
Buying may witness above 1126
Support area 1115. Below ignoring buying momentum for intraday
Selling may witness below 1101
Resistance area 1115
Above ignoring selling momentum for intraday
Charts for Educational purposes only.
Please follow strict stop loss and risk reward if you follow the level.
Thanks,
V Trade Point
