Tata elxis Hello!! Tata elxis is looking like a very good stock technically as it is in an uptrend after the crash of march and now it has nearly doubled till march levels it can see some above high moves. #learner #my_view
TATAELXSI trade ideas


R-0035 Short Term Cash Buy TATAELXSI @914.00-918 SL 885 TGT 975Short Term Cash Buy TATAELXSI @914.00-918 SL 885 TGT 975
About to cross TK line and stock is in uptrend.


Tata Elxsi Buy After 780 !!Hello buddies,
buy only after 780 for target toward 810-835-860, Stoploss: 755
Thanks, tired from writing more about idea LOL
I mention everything in the chart

TATA ELXSI Head and Shoulder PatternIt seems it will fall if it follows the head and shoulder pattern.
Please note this is just a idea, please trade at your own risk.

Head and shoulder pattern in TECHM on Monthly ChartsTECHM Is completing Head and shoulder pattern, BUY for a initial target of Rs.1130 and followed by Rs.1500


TataElxsi - Taken support at 844Support Levels: 844, 835, 828, 821
Resistance Levels: 869, 874, 882
Trendline Support Levels: NA
Trendline Resistance Levels: NA


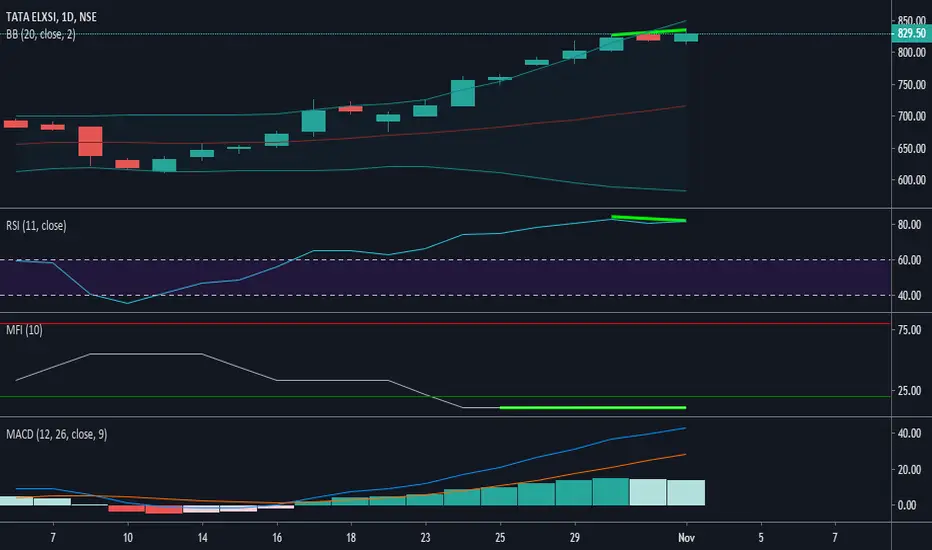
Tata ElxsiTata Elxsi can be shorted once MACD becomes negative, RSI and MFI and Bollinger Band shows divergence, aggresive ones can go short righ away with stop loss of 835 for the target of 803 and if it breaks below 800 one can hold shorts for target of 771 since MACD transition from dark green bar to light green bar shows it has already started to turn, someone who wants to prempt the move can short immediately looking at risk to reward, however conservatives may wait till MACD shows a red bar below zero level

Tataelxsi - Stuck between Support and Trendline ResistanceSupport Levels: 670, 664, 657, 651, 638, 618
Resistance Levels: 688, 695, 700
Trendline Support Levels: NA
Trendline Resistance Levels: 675-679

Tataelxsi - At Important LevelsSupport Levels: 618, 608, 602
Resistance Levels: 638, 651, 657, 664, 670
Trendline Support Levels: NA
Trendline Resistance Levels: 633-638


Tata Elxsi Trade Setup for 24 Aug 2019Reason(s) for Trade:
Stock was moving in a channel range
RSI Positive Divergence
Channel Breakout with Average+ volume is seen
Trade Setup:
Buy if goes above 654.00
For more study & analysis update, join ProfitPattern over telegram - t.me
Disclaimer:
ProfitPattern is a purely educational Research unit and not a SEBI registered analyst/adviser. Please be noted that Risks/losses are associated with stocks trading; and it's all your acts & liability.


