TATA MOTORS NEAR THE BREAKOUTTATA MOTORS NEAR THE BREAKOUT
1. Strong Volume Buildup
2. price Moving above the 50EMA And 200EMA
3.Near The Breakout
4. Good Stock For Swing Trade
TATAMOTORS trade ideas

TATA Motors DVR Chart Analysis on weekly time frameTATA Motors DVR trading near breakout level keep on radar above 444

Tata Motors Weekly Chart AnalysisStock is Trading in a Range and preparing for a breakout.
Strong Uptrend seen on Chart.

Tata motors again ready for upside move On Our Harmonic pattern indicator based trade setup take trade as explained below :-
Early trades Buy or sell below/ above 23.6 %, safe trades buy or sell above / below 41% , after taking trade next upside or downside levels will be target ,
When reverse buy or sell signal appear then book profit on Target or trail SL to 23.6 % If trailing SL hit then early trade can be taken above or below 23.6 and safe trade can b taken above/ below 41% ..
Please note:-
It's working on news based and volitile market very well so exit if SL hit

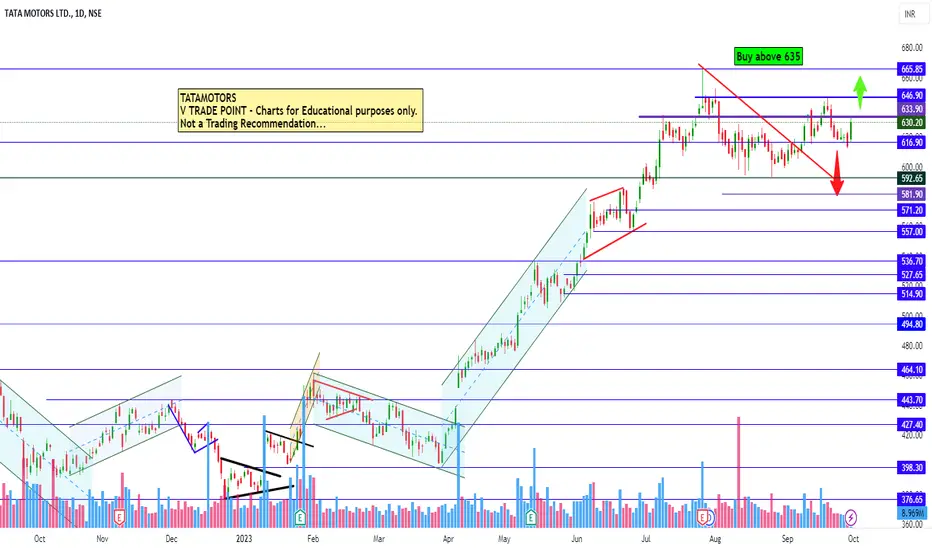
Tata motors view for 3rd OctTata motors view for 3rd Oct
Buying above 635
Charts for Educational purposes only.
Follow strict risk reward and stop loss for the same.
Thanks,
V Trade Point
TATA MOTORS view for today 27th september Wednesday #TATAMOTORS INTRADAY VIEW
TATA MOTORS view for today 27th september Wednesday #TATAMOTORS
Shorting range below 614
Follow strict risk reward and stop loss if you follow the level...
Charts for Educational purposes only.
Thanks,
V Trade Point

TATAMOTORS--Long Or Short??The stock is recently broken the previous resistance @590-605 zone
price broken and retest is observed...
if price failed to move upside...will get an opportunity to enter short side...
This stock is continuously in uptrend from long time...this is good opportunity to continue with this stock in upwards....
Keep safe...

Short term BUY signals - Intraday or ScalpingI think that buyers from this area will be defend this buy position...
Strong buyers will be push up the market again a little bit...
1:2 RRR
Always sl to be when price move 50% tp
Happy trading

TATA MOTORS Once the things are settled in Europe - Tata Motors - Land-rover revenue will multiply 2X - 5X
Targets given here in chart for long-term, tatamotors has potential to achieve it.
EV Player and Diverse product portfolio
FUNDAMENTALS
Market Cap
₹ 2,34,671 Cr.
Current Price
₹ 641
High / Low
₹ 665 / 375
Stock P/E
21.1
Book Value
₹ 136
Dividend Yield
0.31 %
ROCE
6.14 %
ROE
5.62 %
Face Value
₹ 2.00
Promoter holding
46.4 %
EPS last year
₹ 7.27
EPS latest quarter
₹ 9.64
Debt
₹ 1,34,113 Cr.
Pledged percentage
1.82 %
Net CF
₹ -6,272 Cr.
Price to Cash Flow
6.01
Free Cash Flow
₹ 16,443 Cr.
Debt to equity
2.96
OPM last year
9.20 %
OPM 5Year
9.15 %
Reserves
₹ 44,556 Cr.
Price to book value
4.69
Int Coverage
2.13
PEG Ratio
-1.06
Price to Sales
0.62
Sales growth 3Years
9.84 %
Profit Var 3Yrs
31.2 %

A clear BREAKOUT in TATA MOTERS chart! Divergence in RSI, Breakout form long consolidation phase. In the previous week, it made a bullish candle and this breakout gave confirmation of a long upcoming trend. One must add at this level or when it retests major levels.

Tata motors ready for fresh upsideFor all trade on my Auto Harmonic patterns indicator trade setup -
Risky trades can take trade after crossing 23.6% on either side and safe traders can take trade after 41% We can start buying when our Trailing SL hit at 23.6% with SL of recent low our Target will be 41%, 78.6% , 127.2% 161.8% and 223.6 % , when reversal pattern appears on chart we have to trail our SL if trailing SL hit exit from long trade and initiate sell trade ,

Tata motorsStrong breakout of resistance area
Now price resting on resistance level
Other stocks in this sector are also performing well
Took 40% position
Will add more as it unfolds
This is a short term - Medium term bet
TATAMOTORS at an important resistance levelTATAMOTORS is trying to break an important resistance level multiple times but not able to do it since last three times.
Wait for breakout.
Can come out to be a good trade for intraday traders.
Go long if price breaks 629.00 level
1st target - 633.00
2nd target - 636.00

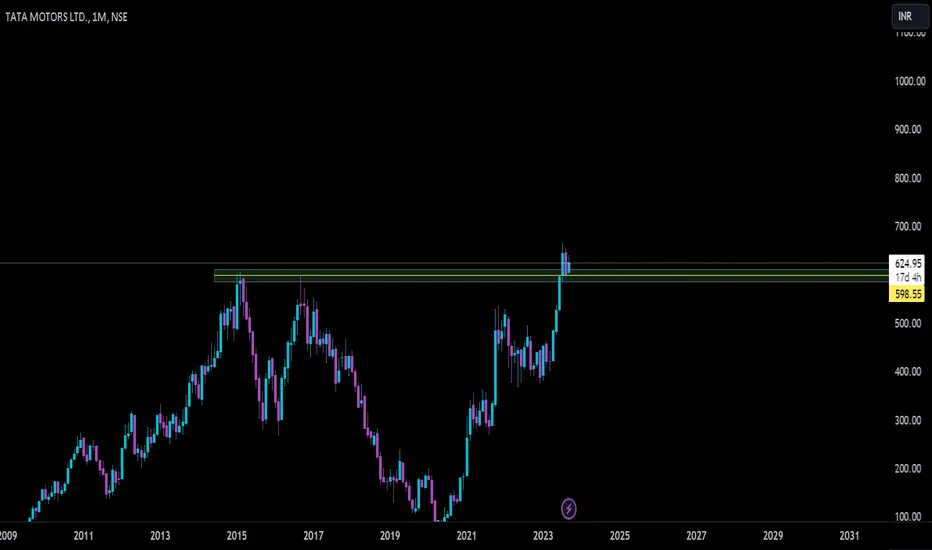
Low Risk and High potential trade opportunity In TATAMOTORSInverse head & shoulders pattern on Monthly Charts.
Breakout and retested back . Looking very attractive with low risk
and high reward potential.

Tata Motors AnalysisIt is at its daily resistance, expected to fall and take support at around 460. On higher timeframe, stock is in uptrend.

Tata Motors - Bullish - Tgt 800TATA MOTORS
🚩 Flag Pattern Breakout Alert! 🚀
Traders and investors, pay attention! We've spotted an exciting chart setup that could lead to significant gains. 📈
Pattern: Flag Pattern 🚩
Signal: Breakout with Strong Volume 🔊
Support: Solid Horizontal Support at Current Price ⚙️
Target: 800 🎯
Disclaimer:
Remember that trading and investing involve risks, and past performance is not indicative of future results. Make sure to conduct your own research, use risk management strategies, and consult with a financial advisor if necessary.
Stay tuned for updates on this exciting trade opportunity, and may the markets be in your favor! 🚀📊

Pin point predictions of Tatamotors for 10-9-23 to 14-9-23Hello Traders,
This is my trade plan for tata motors next week all markings for support and resistance where entry and exit can be taken . For complete plan check below.

Tata Motors Swing Trade Opportunity: Can hit 700+ by DiwaliTata Motors Swing Trade Opportunity: Target 700+ by Diwali
**Chart Analysis:**
Tata Motors (TATAMOTORS) appears to be presenting a compelling swing trade opportunity on the horizon. This analysis is based on a combination of technical factors and a speculative outlook. The stock's current chart pattern suggests potential upward momentum.
**Key Levels on the Chart:**
1. **Support Levels:** Traders should keep an eye on critical support levels, which may provide potential entry points or serve as stop-loss reference points to manage risk. It is advisable to set stop-loss orders to protect your investment.
2. **Resistance Levels:** Identifying resistance levels is equally crucial for setting price targets. Breaking through these levels could indicate a bullish sentiment.
**Trade Strategy:**
The strategy here involves capturing short to medium-term price movements, typically over the course of several days to weeks. The aim is to capitalize on price fluctuations.
**Risk-Reward Assessment:**
It's important to note that swing trading carries inherent risks. While there is potential for significant rewards, there is also the risk of losses. Here are some risk-reward considerations:
**Risk:**
- Market Volatility: The stock market can be highly volatile, and unforeseen events can impact prices.
- Company Performance: Tata Motors' performance is influenced by various factors, including economic conditions and industry trends.
- Speculative Nature: Setting a specific price target (700+ by Diwali) is speculative, and achieving such a target is uncertain.
**Reward:**
- Potential Upside: If the trade goes as planned, reaching or exceeding the 700+ target by Diwali could yield substantial profits.
- Short to Medium-Term Gains: Swing trading offers the opportunity to profit from relatively short-term price movements.
**Conclusion:**
Tata Motors presents an interesting swing trading opportunity, but it's crucial to approach it with a clear strategy and an understanding of the associated risks. Traders should conduct thorough research, closely monitor the stock's performance, and be prepared to adjust their positions as needed to manage risk effectively. Additionally, seeking guidance from a financial advisor or conducting a more detailed analysis of the stock is advisable before making any trading decisions. Remember that the stock market involves inherent uncertainty, and past performance is not indicative of future results.

TATA MOTORS CORRECTION PHASE SLIGHT BEARISHTata Motors Correcting as RSI crossover, weekly RSI Diversion
slight bearish till 560 if crossesbelow 590

Tata motor, clear sign of Head & ShoulderA down ward trend is expected in Tata motor, Head and shoulder format target is 585 & 546.

Short Term Sell Signal1:2 RRR
Volume Profile accumulation Levels
* Trade at your own analysis & Risk

Tata Motors Long CallTatamotors breaking its resistance after couple of years, if it sustains in this level and starts moving up its a good investment stock.

Pin Point Predictions of Tata Motors For 28 to 1 sep 23Hello Traders,
My next week planning to trade this stock is in two parts first in form of marking that you are seeing. Second is how to trade these marking as entry and exit . That you can check below.
