Tata Motor Inverse Head and Shoulder Bullish Reversal Tata Motor Inverse Head and Shoulder Bullish Reversal
TATAMOTORS trade ideas

Tata Motors Looks Good From Here.. @730Tata Motors Stock Outlook – Bullish Momentum Ahead 🚗📈
Tata Motors is currently trading around **₹730**, showcasing strong upward momentum backed by healthy **volume participation** in recent sessions. As a long-term investor and market observer, I remain **bullish** on the stock, with the next **6 to 8 months looking green and promising** for the auto giant.
Technical Overview:
* **Current Price**: ₹730
* **Trend**: Bullish
* **Volume**: Consistently strong, indicating institutional interest
* **Support Zone**: ₹690–₹700
* **Stop Loss**: A sensible stop loss can be placed at around **₹690**, below which the short-term trend may weaken. This level provides a cushion for volatility while protecting capital.
🌐 Fundamental Strength:
Tata Motors has been aggressively diversifying its portfolio across **electric vehicles (EVs)**, **commercial vehicles**, and **passenger cars**, both in domestic and global markets. Its subsidiary, Jaguar Land Rover (JLR), continues to perform well, especially in premium segments.
With India's EV adoption gaining momentum and Tata Motors positioned as a leader in this space, **long-term growth potential is robust**. The company is also expanding capacity and launching new models, which will likely fuel demand and revenue growth.
🔍 Diversification Advantage:
The strength of Tata Motors lies not just in its core automotive business but also in how it's **diversified across product lines and geographies**:
* **EV Segment**: Nexon EV, Punch EV gaining traction
* **International Markets**: JLR continues to grow in luxury and sustainability-driven niches
* **Commercial Vehicles**: Market leadership in India
This strategic spread reduces risk and adds stability to its earnings, making it a reliable long-term pick.
### 📆 Outlook:
With improving chip supply, a growing economy, and upcoming launches, **Tata Motors is well-placed to benefit from both cyclical and structural tailwinds**. Over the next **6–8 months**, price targets of ₹800–₹850 look achievable, supported by technical strength and fundamental backing.
**#TataMotors #BullishView #StockMarketIndia #EVRevolution #AutoStocks #LongTermInvesting #Nifty50 #TechnicalAnalysis #TataPower #GreenFuture #StockAlert #SmartInvesting

TATA Motors India - Trading 680 to 1000Daily chart,
The stock NSE:TATAMOTORS rallied from 535 to 742 since 7 April 2025, and I think a cooling down (minor correction) should take place before resuming the bullish trend.
Expected to test the nearest support around 680
Technical indicator RSI is near the overbought zone. A signal that a correction (downwards or sideways) can be soon.
So, a new entry (Buy) should be in parts after testing the support 685 - 680 and rebounding.
Above 745 for 2 days, the target will be 880 then 1000
Consider the stop loss below 680


Tata Motor Analysis Looking at the recent chart patterns, it seems that Tata Motors shares have the potential to rise in the coming time. The stock has been forming higher highs and higher lows, indicating a strong uptrend. Key technical indicators such as moving averages and RSI are also showing bullish signals. There is consistent buying interest at lower levels, suggesting investor confidence. If the stock breaks key resistance levels with volume support, it may see further upward movement. The overall market sentiment and sector performance also support this view. However, investors should stay cautious and monitor key levels before making any decisions.

Tata Motors on breakout with good VolumeTata Motors 720 has given good breakout with volume. If sustains could move to 882.
Currently trading at 7.4 P/E of its Fy26 EPS and available at a discount P/E of its 5 Year P/E 16 and sector P/E of 24.

TATA MOTORS Ltd view for Intraday 12th May #TATAMOTORS TATA MOTORS Ltd view for Intraday 12th May #TATAMOTORS
Resistance 730 Watching above 733 for upside movement...
Support area 720 Below 720 ignoring upside momentum for intraday
Watching below 717 for downside movement...
Above 730 ignoring downside move for intraday
Charts for Educational purposes only.
Please follow strict stop loss and risk reward if you follow the level.
Thanks,
V Trade Point

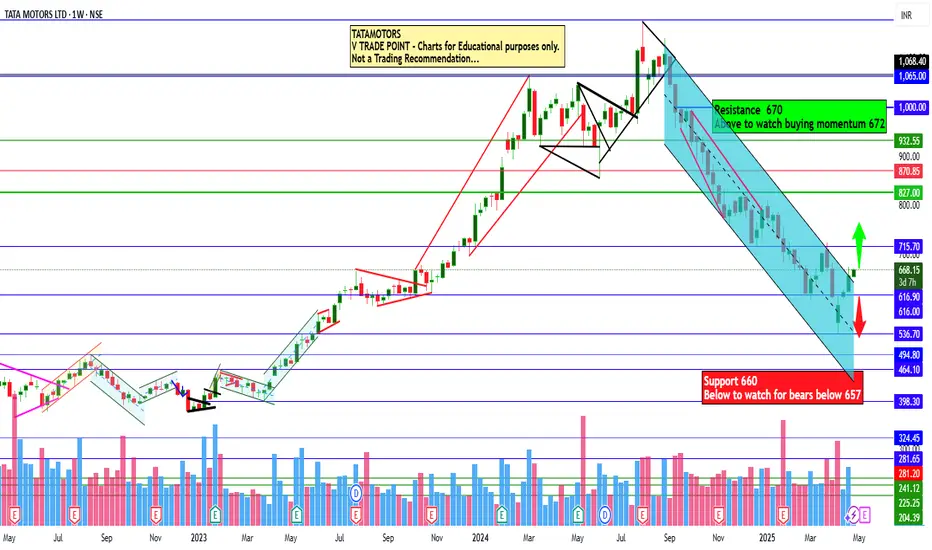
Equity Research - TATA MOTORS LTD 📈 Buy Zone: ₹670.50 – ₹680.30
🎯 Target: ₹740.00
🛑 Stop Loss: ₹641.70
💹 CMP: ₹680.30
Technical Highlights:
✅ Bullish volume spike
✅ RSI above 60 – strong momentum
✅ Price above 20EMA & 50EMA
✅ Breakout and retest on 15m & 1H chart
✅ Good risk-reward setup
📊 Strategy: Wait for confirmation candle on 15min TF above ₹681 for entry.
📉 Stop loss below recent swing low at ₹641.70.
For Education Purposes Only

Simple Case Study on Swing TradingI present here a simple case study showing the movements by a TATAMOTORS stock.
Timing the market is not our peice of cake , so what could have been done.
Learning how to swing with flow of market trajectory and cycles is important.

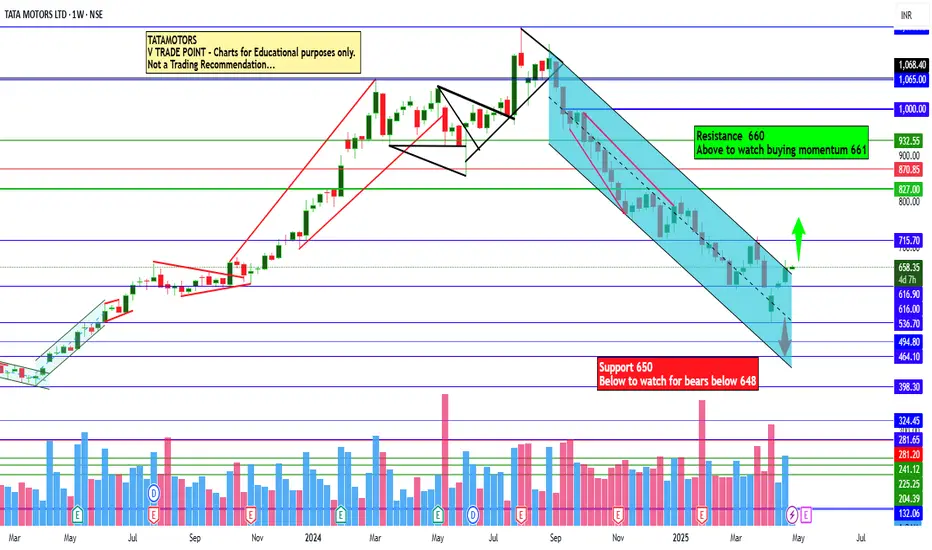
TATA Motors Ltd view for Intraday 5th May #TATAMOTORS TATA Motors Ltd view for Intraday 5th May #TATAMOTORS
Resistance 670 Watching above 671 for upside movement...
Support area 650 Below 660 ignoring upside momentum for intraday
Watching below 648 for downside movement...
Above 660 ignoring downside move for intraday
Charts for Educational purposes only.
Please follow strict stop loss and risk reward if you follow the level.
Thanks,
V Trade Point

Tata Motors - Short term target - 850 to 900Tata Motors has formed Shark pattern confirmation.
Based on Fib targets it will have resistance at 850 to 900.
In short term it will have potential to reach 900 with following targets,
700 / 750 / 780 / 820 / 860 & 900.
2 Weekly candle close above 900 will have further potential upside.

Tatamotors Ltd view for Intraday 2nd May #TATAMOTORS Tatamotors Ltd view for Intraday 2nd May #TATAMOTORS
Resistance 650-653 Watching above 655 for upside movement...
Support area 640 Below 645 ignoring upside momentum for intraday
Watching below 638 for downside movement...
Above 645 ignoring downside move for intraday
Charts for Educational purposes only.
Please follow strict stop loss and risk reward if you follow the level.
Thanks,
V Trade Point

we can go long on tatamotors cmp 670-650we cango long on tatmotors its holding orderblocks level
expected upside range 980 to 1180++
go long cmp 670-650
stoploss - 580 ( almost 100 points)
1st target - 990 (320 points)
2nd targte - 1180 (510 points)
Risk to rewards - 1:3 and 1:5+
always follow the given stoplos level view are only long term holdings

TATA Motors Ltd view for Intraday 29th April #TATAMOTORS TATA Motors Ltd view for Intraday 29th April #TATAMOTORS
Resistance 670 Watching above 672 for upside movement...
Support area 660 Below 660 ignoring upside momentum for intraday
Watching below 657 for downside movement...
Above 670 ignoring downside move for intraday
Charts for Educational purposes only.
Please follow strict stop loss and risk reward if you follow the level.
Thanks,
V Trade Point
Live buying signal in TataMotors at 664Live Khareedo (Buy) signal in Tata Motors at 664. Lets see how long it will go up.
Note: This is not a buy/sell trade call, trade at your own will and analysis. Use stop loss too.

TATA Motors Ltd view for Intraday 28th April #TATAMOTORSTATA Motors Ltd view for Intraday 28th April #TATAMOTORS
Resistance 660 Watching above 661 for upside movement...
Support area 650 Below 650 ignoring upside momentum for intraday
Watching below 648 for downside movement...
Above 660 ignoring downside move for intraday
Charts for Educational purposes only.
Please follow strict stop loss and risk reward if you follow the level.
Thanks,
V Trade Point
TataMotors is in bullish zoneMy custom indicators named Jadugar and Paka Kam generated signals in last 1H candle that Becho @ 658.4 means sell at this price, lets see how much it will drop.
Note: This is not a buy/sell trade call, this is education purpose post, trade at your own will, Use stop loss.

Tata Motors Technical🇮🇳🛵#TATA Motors is trading at ₹649.85 on the NSE, at the time of tweet, reflecting a slight increase of 5% from the previous Weak close.
Over the past three years, the stock has delivered a strong return of 43.57%, outperforming the Nifty 100’s 37.57%.
In my views bottom has been made and right time add in the portfolio
Chart For your reference

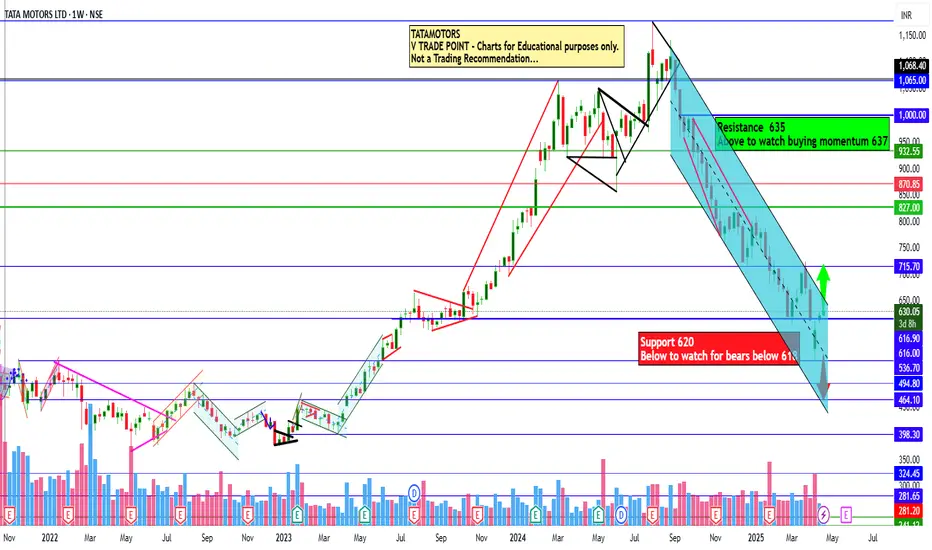
TATA Motors Ltd view for Intraday 23rd April #TATAMOTORSTATA Motors Ltd view for Intraday 23rd April #TATAMOTORS
Resistance 635 Watching above 637 for upside movement...
Support area 620 Below 630 ignoring upside momentum for intraday
Watching below 618 for downside movement...
Above 630 ignoring downside move for intraday
Charts for Educational purposes only.
Please follow strict stop loss and risk reward if you follow the level.
Thanks,
V Trade Point
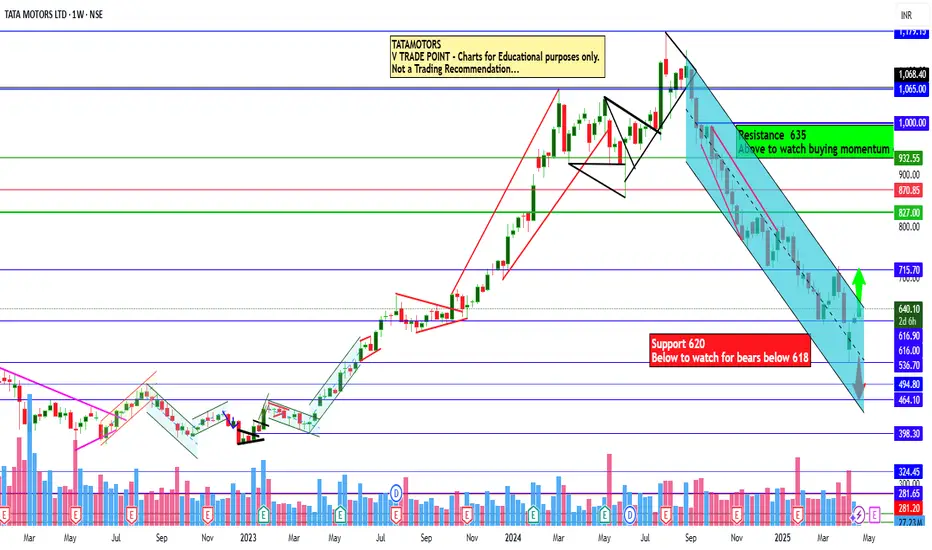
TATA Motors Ltd view for Intraday 22nd April #TATAMOTORS TATA Motors Ltd view for Intraday 22nd April #TATAMOTORS
Resistance 635 Watching above 637 for upside movement...
Support area 620 Below 630 ignoring upside momentum for intraday
Watching below 618 for downside movement...
Above 630 ignoring downside move for intraday
Charts for Educational purposes only.
Please follow strict stop loss and risk reward if you follow the level.
Thanks,
V Trade Point
Tata Motors at ₹600: Support Zone in Focus...
Tata Motors at Key Technical Support: A Long-Term Buying Opportunity..?
Tata Motors is currently trading near the ₹600 level, which marks a significant technical support zone. This level is important not only because of historical price action but also because it aligns with the 0.5 Fibonacci retracement level of the broader uptrend seen in recent months.
The ₹600 mark has acted as a strong support on the monthly chart, suggesting a potential reversal point for long-term investors looking for value entry. From a purely technical perspective, this level could provide a solid foundation for a possible bounce or even a continuation of the longer-term bullish trend.
However, it is important to note that while technical indicators may suggest an attractive entry point, Tata Motors remains subject to various fundamental factors that could drive volatility in the short to medium term. These include:
- JLR (Jaguar Land Rover) Sales Data
- Quarterly Earnings Results
- Global Tariff and Trade Policy News
These elements can significantly impact investor sentiment and stock performance, sometimes overriding technical signals.
Disclaimer: This analysis is based solely on technical chart patterns and should not be considered financial advice. Market conditions can change rapidly, and it’s crucial to conduct your research and consider fundamental factors before making any investment decisions.

TATA MOTORSI am feeling bullish on Tata Motors for the short term. Let's see how it reacts around the key level of ₹800. If it holds and shows strength, we can decide whether to stay bullish for the long term. For now, I remain bullish.

Jaguar Land Rover Temporarily Halts U.S Shipments Amid TariffsJaguar Land Rover (JLR), owned by Tata Motors, has paused shipments to the U.S. market this April. The move follows a 25% import tax on vehicles imposed by U.S. President Donald Trump. JLR described the U.S. as a vital market and stated it is now adjusting to new trade rules with business partners.
The pause is a short-term step. The company aims to finalize longer-term strategies to manage the new tariffs. Analysts believe other British carmakers may soon follow this approach. Britain's auto sector faces pressure from falling domestic demand and the costly transition to electric vehicles.
David Bailey, a University of Birmingham professor, predicts more stoppages. He said automakers will reassess their plans amid rising costs and trade uncertainty. Recent data shows U.K. car production fell 13.9% last year to 779,584 units. Over 77% of these vehicles were exported.
The Society of Motor Manufacturers and Traders (SMMT) voiced concern. CEO Mike Hawes said the timing worsens an already challenging period. He urged swift trade talks to protect jobs and growth. The SMMT has stayed in regular contact with the U.K. government to seek solutions.
To soften the tariff’s impact, carmakers rushed to build inventories in the U.S. JLR was among them. U.K. car exports to the U.S. jumped 38.5% in Dec, 12.4% in January and 34.6% in February.
According to official figures, British automakers shipped £8.3 billion ($10.7 billion) worth of cars to the U.S. in the 12 months through September. Cars remain Britain’s largest goods export to the U.S. However, goods make up a smaller portion of overall trade. Services account for 68.2% of the £179.4 billion ($231.2 billion) in total U.K.-U.S. trade during the same period.
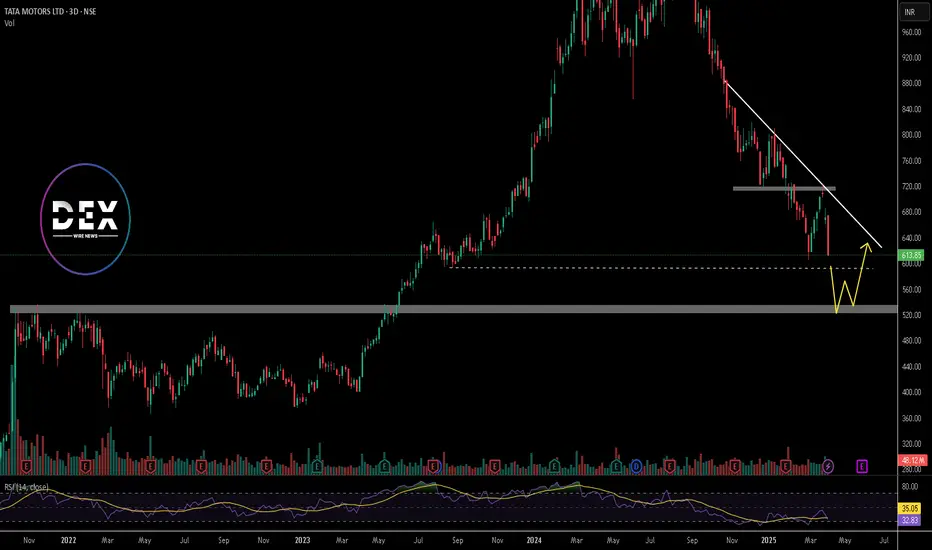
JLR is not independently listed. But looking at the parental company, Tata Motors (TATAMOTORS.BO) trades on India’s BSE. Its stock closed at INR 613.85 on April 4th, 2025 (6.15%).
Technical Analysis: Bearish Momentum Since July 2024 Highs
Tata Motors stock peaked at INR 1179 in July 2024. Since then, it has shown a sharp downtrend. It has surged in bearish momentum and has been breaking major support levels. In late January 2025, the price broke below key support at INR 715 and has retested it in March 2025. Currently, it trades lower and is approaching the next support at around INR 591.
If this level fails to hold, the price may fall to INR 525. The downtrend has persisted for months, indicating sustained bearish pressure in the market. The weekly RSI now reads 32, derived from deep bearish sentiment. If the RSI dips further, it may signal oversold conditions. However, the current momentum suggests the stock could still drop.
If INR 591 holds, a short-term bounce may follow, with a short-term recovery phase that could push the stock toward the descending trendline. Still, bears maintain control for now, and a break below 591 may accelerate further losses.