Tata Motors view for Intraday 18th September #TATAMOTORS Tata Motors view for Intraday 18th September #TATAMOTORS
Buying may witness above 983
Support area 969-970. Below ignoring buying momentum for intraday
Selling may witness below 969
Resistance area 980
Above ignoring selling momentum for intraday
Charts for Educational purposes only.
Please follow strict stop loss and risk reward if you follow the level.
Thanks,
V Trade Point
TATAMOTORS trade ideas

TATAMOTORSHi guys,
In this chart i Found a Demand Zone in TATAMOTORS CHART for Positional entry,
Observed these Levels based on price action and Demand & Supply.
*Don't Take any trades based on this Picture.
... because this chart is for educational purpose only not for Buy or Sell Recommendation..
Thank you


TATA MOTORS LTD on uptrend [ms]Tata motors is going to upmove and they are started wave 3.iii
first target 1200
second target 1900
this chart is only studies purpose

Tata Motor Long 1067-1010 RR 1:8Tata Motors
Tasta Motors Daily Supply 1136
Tasta Motors Weekly Supply
MTF Analysis
Tata Motors Yearly Breakout 601
Tata Motors 6 Month Demand BUFL 601
Tata Motors Qtrly Demand BUFL 665
Tata Motors Monthly Demand DMIP 1010
Tata Motors Daily Demand DMIP 1010
Tata Motors Daily Demand DMIP 1067
Tata Motors Weekly DMIP 975
ENTRY -1 1010
ENTRY -2 1034
SL 967
Target 1348
Last High 1179
RR 7.86

TATA MOTORS FOR LONG TERMFor the one's who missed the rally or want to invest in Tata Motors, this chart will guide you to add more on dips or buy at support.
This analysis is only with long term in view.
Save the chart and keep track of price.

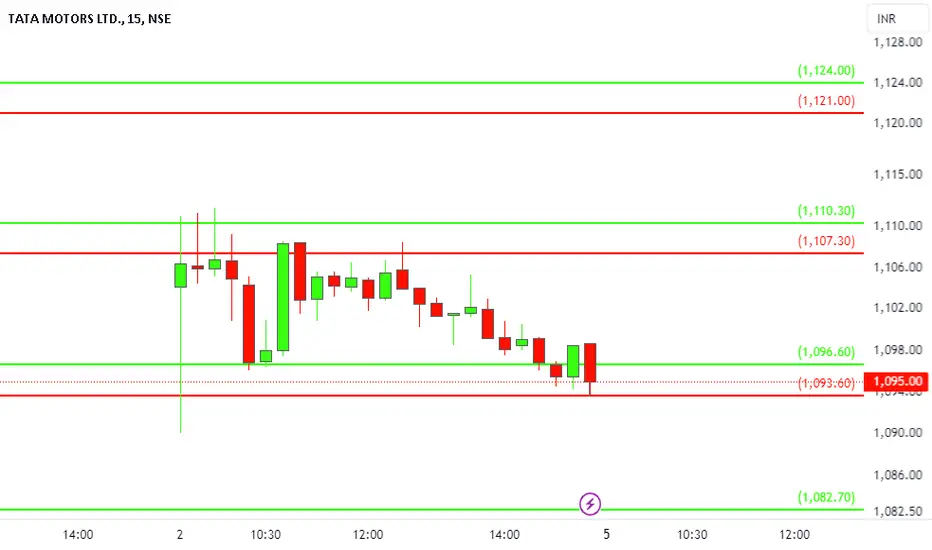
Tata Motors Ltd view for Intraday 4th September #TATAMOTORSTata Motors Ltd view for Intraday 4th September #TATAMOTORS
Buying may witness above 1093
Support area 1077-1080. Below ignoring buying momentum for intraday
Selling may witness below 1077
Resistance area 1090-1093
Above ignoring selling momentum for intraday
Charts for Educational purposes only.
Please follow strict stop loss and risk reward if you follow the level.
Thanks,
V Trade Point
Tata motors Long Fresh Demand Formed 1088Tata Motor already Trading from Monthly Demand Level 1010
Tata Motors Daily DMIP at 1067 & N already reacted
Tata Motors Daily Demand Cap & DMIP 1088
Target 1350

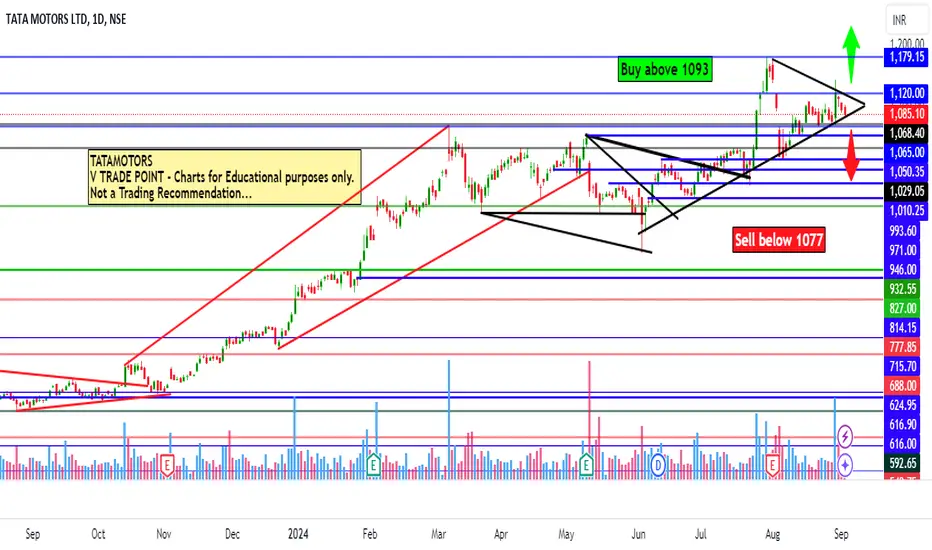
Tata Motors view for Intraday 2nd September #TATAMOTORS Tata Motors view for Intraday 2nd September #TATAMOTORS
Buying may witness above 1118
Support area 1098-1100.. Below ignoring buying momentum for intraday
Selling may witness below 1098
Resistance area 1115-1118
Above ignoring selling momentum for intraday
Charts for Educational purposes only.
Please follow strict stop loss and risk reward if you follow the level.
Thanks,
V Trade Point
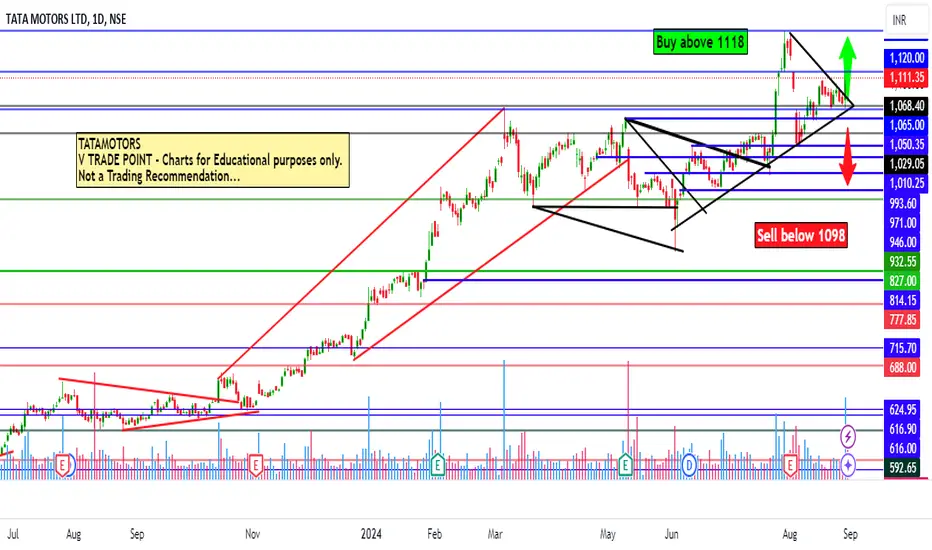
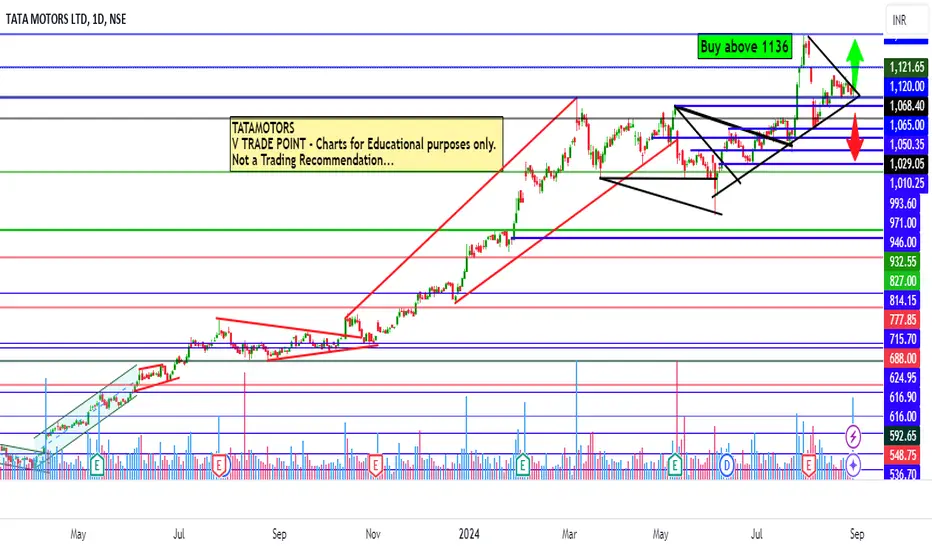
TATA Motors Ltd Ltd view for Intraday 30th August #TATAMOTORS TATA Motors Ltd view for Intraday 30th August #TATAMOTORS
Buying may witness above 1136
Support area 1120.. Below ignoring buying momentum for intraday
Charts for Educational purposes only.
Please follow strict stop loss and risk reward if you follow the level.
Thanks,
V Trade Point
Tatamotors Ltd view for Intraday 27th August#TATAMOTORS
Tatamotors Ltd view for Intraday 27th August
Buying may witness above 1101
Support area 1085. Below ignoring buying momentum for intraday
Selling may witness below 1075
Resistance area 1085
Above ignoring selling momentum for intraday
Charts for Educational purposes only.
Please follow strict stop loss and risk reward if you follow the level.
Thanks,
V Trade Point

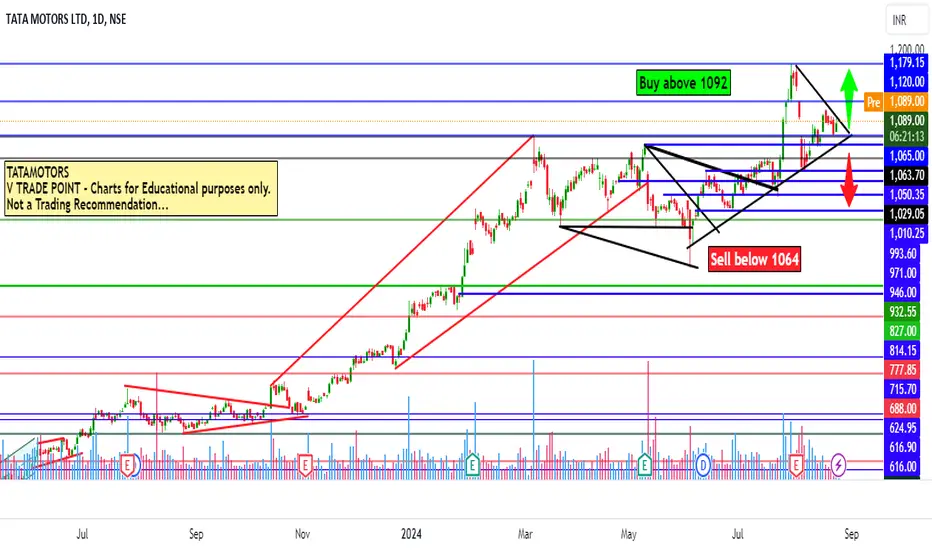
Tata Motors Ltd intraday level for 26th Aug #TATAMOTORS Tata Motors Ltd intraday level for 26th Aug #TATAMOTORS
Buying may witness above 1092
Support area 1080. Below ignoring buying momentum for intraday
Selling may witness below 1064
Resistance area 1080
Above ignoring selling momentum for intraday
Charts for Educational purposes only.
Please follow strict stop loss and risk reward if you follow the level.
Thanks,
V Trade Point
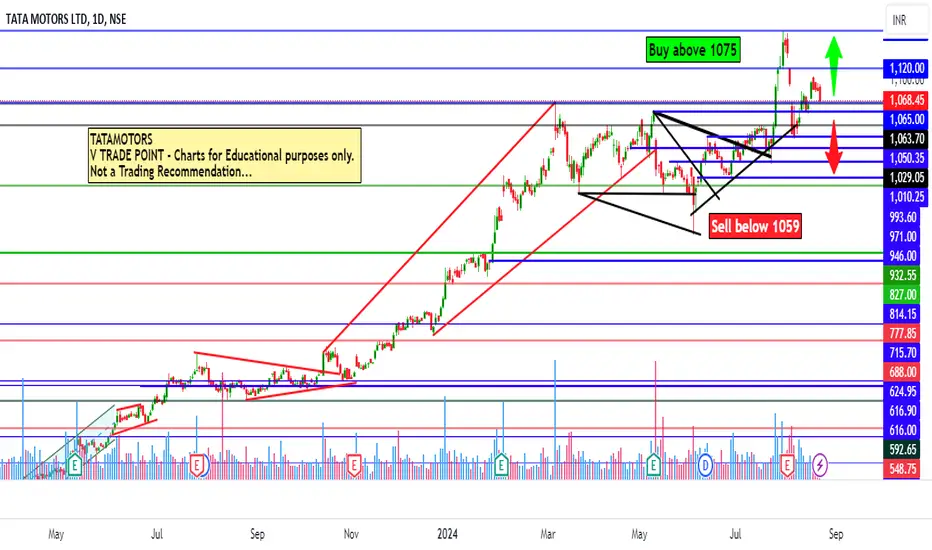
TATA Motors Ltd intraday level for 23rd Aug #TATAMOTORS TATA Motors Ltd intraday level for 23rd Aug #TATAMOTORS
Buying may witness above 1075
Support area 1067. Below ignoring buying momentum for intraday
Selling may witness below 1059
Resistance area 1067
Above ignoring selling momentum for intraday
Charts for Educational purposes only.
Please follow strict stop loss and risk reward if you follow the level.
Thanks,
V Trade Point
TATA MOTORS AGGRESSIVE LONGprice is making HH & HL hence expecting price to bounce from the 1st level & not to retrace back to lower level.

Tata Motors Ltd intraday level for 16th Aug #TATAMOTORS Tata Motors Ltd intraday level for 16th Aug #TATAMOTORS
Buying may witness above 1075
Support area 1065. Below ignoring buying momentum for intraday
Selling may witness below 1049
Resistance area 1065. Above ignoring selling momentum for intraday
Charts for Educational purposes only.
Please follow strict stop loss and risk reward if you follow the level.
Thanks,
V Trade Point

Tata Motors Intraday level for 12th Aug #TATAMOTORS Tata Motors Intraday level for 12th Aug #TATAMOTORS
Buying may witness above 1082
Support area 1065-1070. Below ignoring buying momentum for intraday
Selling may witness below 1049
Resistance area 1065-1070. Above ignoring selling momentum for intraday
Charts for Educational purposes only.
Please follow strict stop loss and risk reward if you follow the level.
Thanks,
V Trade Point

Strong candle in tata motors Weekly chart of tata motors will gives as very good and strong movement . Hammer candle was made in support with heavy buying volumes .
Buy it on 1048-1070
Target 1120 1156 1180 1250
Sl 1020

TATA MOTORS S/R Support and Resistance Levels:
Support Levels: These are price points (green line/share) where a downward trend may be halted due to a concentration of buying interest. Imagine them as a safety net where buyers step in, preventing further decline.
Resistance Levels: Conversely, resistance levels (red line/shade) are where upward trends might stall due to increased selling interest. They act like a ceiling where sellers come in to push prices down.
Breakouts:
Bullish Breakout: When the price moves above resistance, it often indicates strong buying interest and the potential for a continued uptrend. Traders may view this as a signal to buy or hold.
Bearish Breakout: When the price falls below support, it can signal strong selling interest and the potential for a continued downtrend. Traders might see this as a cue to sell or avoid buying.
20 EMA (Exponential Moving Average):
Above 20 EMA: If the stock price is above the 20 EMA, it suggests a potential uptrend or bullish momentum.
Below 20 EMA: If the stock price is below the 20 EMA, it indicates a potential downtrend or bearish momentum.
Disclaimer:
I am not a SEBI registered. The information provided here is for learning purposes only and should not be interpreted as financial advice. It's important to remember that while these indicators can be useful, they are not foolproof. Always consider the broader market context and consult with a qualified financial advisor before making any investment decisions.

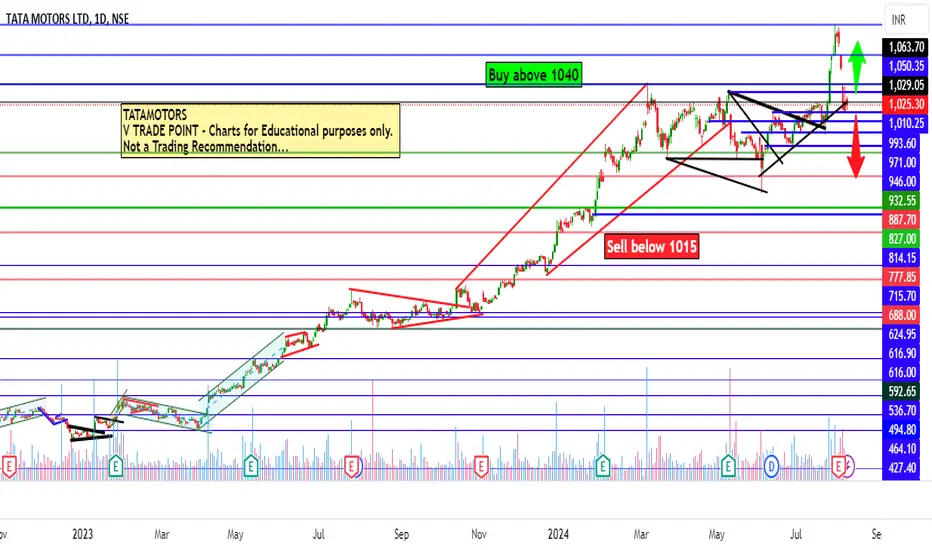
Tata Motors Ltd intraday level for 8th Aug #TATAMOTORS Tata Motors Ltd intraday level for 8th Aug #TATAMOTORS
Buying may witness above 1040
Support area 1025. Below ignoring buying momentum for intraday
Selling may witness below 1015
Resistance area 1025. Above ignoring selling momentum for intraday
Charts for Educational purposes only.
Please follow strict stop loss and risk reward if you follow the level.
Thanks,
V Trade Point
TATA MOTORS- BUY#TATAMOTORS IS A GREAT BUY AT 1000-1010 FOR TARGET OF 1170 WITH THE STOP LOSS OF 945.
DM in case you need more analysis.

Tata Motors - Towards 1172Tata Motors has completed shark formation with bottom of 856.
After that it has completed Target1 & reached 1010
Current direction of trend will take it towards 1172 by Mid Aug'24.

Tat motors LongTata Motor Strong Support by Monthly Weekly & Daily Demand
all MTF are up
1010-950
Target 1500

TATAMOTORS KEY LEVELSExplanation:
This is a very useful trading system. This means that you should not take a trade blindly, but rather that there is another confirmation to take the trade you can use this for perfect entry and perfect exit
This trading opportunity is based on volume, previous price, and price range , are included
Entry/Exit point's:
- It has very easy entry and exit points
- In this pair of lines with two colors are given (RED AND GREEN)
- In this the GREEN line is used to take long entry and the RED line is used to take short entry (But it is all based on a more conformation from your trading plan)
Stop Loss/Take Profit:
Stop Loss
- According to this, if you take a long trade, its stop loss will be the RED line just below ( A trade can exit either when the price crosses the RED line or the 5 minute candlestick crosses the RED line. (This can be done according to your preference) )
- A short entry should use the opposite rules to a long entry
Take Profit
-When you take a long entry according to the profit to be booked is on the next RED line above. ( Or if there are other reasons, it can be a safe exit )
- Opposite rules for booking profit on long entry are to book profit on short trade. ( The GREEN line above is the stop loss of short entry )
Timeframe:
According to this, the time frame you should use while taking trades is 5 minutes time frames . (5 minute time frame works well in this)
Risk Disclaimer:
Leave a comment if you like my entry setup. This share is for educational learning purposes only, and I am not responsible for your profit or loss. Note: For more details, check the chart.