Tata motors intraday level for today #TATAMOTORS Tata motors intraday level for today #TATAMOTORS
Buying opportunity above 971
Selling opportunity below 955
Charts for educational purposes only.
Please follow strict risk reward and stop loss if you follow the level.
Thanks,
V Trade Point
TATAMOTORS trade ideas

TATA MOTORS S/R Support and Resistance Levels: In technical analysis, support and resistance levels are significant price levels where buying or selling interest tends to be strong. They are identified based on previous price levels where the price has shown a tendency to reverse or find support.
Support levels are represented by the green line and green shade, indicating areas where buying interest may emerge to prevent further price decline.
Resistance levels are represented by the red line and red shade, indicating areas where selling pressure may arise to prevent further price increases. Traders often consider these levels as potential buying or selling opportunities.
Breakouts: Breakouts occur when the price convincingly moves above a resistance level (red shade) or below a support level (green shade). A bullish breakout above resistance suggests the potential for further price increases, while a bearish breakout below support suggests the potential for further price declines. Traders pay attention to these breakout signals as they may indicate the start of a new trend or significant price movement.
Disclosure: I am not SEBI registered. The information provided here is for learning purposes only and should not be interpreted as financial advice. It is important to consult with a qualified financial advisor before making any investment decisions. Tweets neither advice nor endorsement.

Tata Motors-1-Chart AnalysisTata motors CMP:953.95; RSI: 55;
Tata motors, chart is showing signs of fatigue and weakness, is poised to slide into consolidation phase and may retrace- back to a zone of (Rs 840-775) . Tata motors is fundamentally strong counter will be a good buy in a zone at 800-850. Sentiment may reverse for a momentarily if script closes above breakout ceiling of 1070 on closing basis for 2 consecutive days, then swing-target of 1220 is also possible.
On long term basis Target-1 is positioned at 1550 level and new leg of rally may take script to 2020 levels in 10 to 12 months’ time frame.
As of now no new position should be taken in the script, those who hold the script should keep a strict stop loss of Rs: 898.
New position should taken either at 800-850 level or on breakout confirmation @1070 .
✅If you resonate with the Ideas, pls Share, Like & boost ideas and follow to never miss a new idea! ✅

Tata Motors-1-Chart AnalysisTata motors CMP:947.50; RSI: 53;
Tata motors, chart is showing signs of fatigue and weakness, is poisd to slide into consolidation phase and may retrace- back to a zone of (Rs 840-775) . Tata motors is fundamentally strong counter will be a good buy in a zone at 800-850. Sentiment may reverse for a momentarily if script closes above breakout ceiling of 1070 on closing basis for 2 consecutive days, then swing-target of 1220 is also possible.
On long term basis Target-1 is positioned at 1550 level and new leg of rally may take script to 2020 levels in 10 to 12 months’ time frame. As of now no new position should be taken in the script, those who hold the script should keep a strict stop loss of Rs: 898.
New position should taken either at 800-850 level or on breakout confirmation @1070 .
✅If you resonate with the Ideas, pls Share, Like & boost ideas and follow to never miss a new idea!✅

TATA MOTORS S/R Support and Resistance Levels: In technical analysis, support and resistance levels are significant price levels where buying or selling interest tends to be strong. They are identified based on previous price levels where the price has shown a tendency to reverse or find support.
Support levels are represented by the green line and green shade, indicating areas where buying interest may emerge to prevent further price decline.
Resistance levels are represented by the red line and red shade, indicating areas where selling pressure may arise to prevent further price increases. Traders often consider these levels as potential buying or selling opportunities.
Breakouts: Breakouts occur when the price convincingly moves above a resistance level (red shade) or below a support level (green shade). A bullish breakout above resistance suggests the potential for further price increases, while a bearish breakout below support suggests the potential for further price declines. Traders pay attention to these breakout signals as they may indicate the start of a new trend or significant price movement.
Disclosure: I am not SEBI registered. The information provided here is for learning purposes only and should not be interpreted as financial advice. It is important to consult with a qualified financial advisor before making any investment decisions. Tweets neither advice nor endorsement.

Good time to book profits in Tata MotorsAfter a tremendous rally I see the prices will slowly go down. As per Fibonacci high chances it can correct even 50%. Unless there is a trend change good to be away from this stock.

TATA MOTORS ( Avoid Fresh Entry )Even after strong Quarterly numbers , is Tata Motors undergoing correction mode ?
Technically, Tata Motors has given a Breakdown from Ascending triangle pattern
The Close has gone below 50 EMA, the 10 and 20 ema following downward slope
The RSI is below 60, Both RS also nearing to 0
The volumes below dont look much Bullish as we can see that there are Huge red volumes at regular interval
Will Tata Motor find its support near the Fib retracement levels and coincide with 200 ema support ?
Will be interesting to check. As of now , No Fresh entry. Wait for Breakout above Resistance zone.

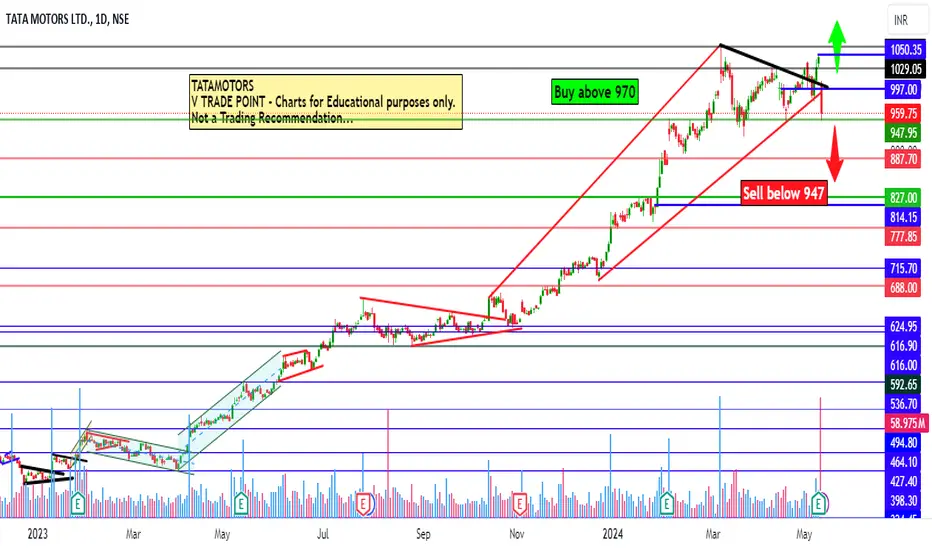
Intraday view for Tatamotors for today 14th May 2024Intraday view for Tatamotors for today 14th May 2024
970 above only for bulls
947 below sellers chance again...
Charts for educational purposes only.
Not a Trading Recommendation.
Thanks,
V Trade Point
TATA MOTORS S/RSupport and Resistance Levels: In technical analysis, support and resistance levels are significant price levels where buying or selling interest tends to be strong. They are identified based on previous price levels where the price has shown a tendency to reverse or find support.
Support levels are represented by the green line and green shade, indicating areas where buying interest may emerge to prevent further price decline.
Resistance levels are represented by the red line and red shade, indicating areas where selling pressure may arise to prevent further price increases. Traders often consider these levels as potential buying or selling opportunities.
Breakouts: Breakouts occur when the price convincingly moves above a resistance level (red shade) or below a support level (green shade). A bullish breakout above resistance suggests the potential for further price increases, while a bearish breakout below support suggests the potential for further price declines. Traders pay attention to these breakout signals as they may indicate the start of a new trend or significant price movement.
Disclosure: I am not SEBI registered. The information provided here is for learning purposes only and should not be interpreted as financial advice. It is important to consult with a qualified financial advisor before making any investment decisions. Tweets neither advice nor endorsement.

TATAMOTORS BACK ON DAILY RESISTANCE, WILL IT GO ABOVE 1150 NEXT?TATAMOTORS might establish a fresh peak provided there's ample volume to breach the highlighted resistance zone. Therefore, it's prudent to monitor this level closely for either a breakout or confirmation of a reversal, which will determine the stock's future trajectory. A decisive breach of the resistance could propel it to a new high, potentially surpassing 1155. Conversely, a bearish reversal and breakout below the floor price of 945 would negate the bullish outlook.

Plan for 13th May 2024 Nifty future and banknifty future analysis and intraday plan in kannada.
This video is for information/education purpose only. you are 100% responsible for any actions you take by reading/viewing this post.
please consult your financial advisor before taking any action.
----Vinaykumar hiremath, CMT

TATA MOTORS S/R Support and Resistance Levels: In technical analysis, support and resistance levels are significant price levels where buying or selling interest tends to be strong. They are identified based on previous price levels where the price has shown a tendency to reverse or find support.
Support levels are represented by the green line and green shade, indicating areas where buying interest may emerge to prevent further price decline.
Resistance levels are represented by the red line and red shade, indicating areas where selling pressure may arise to prevent further price increases. Traders often consider these levels as potential buying or selling opportunities.
Breakouts: Breakouts occur when the price convincingly moves above a resistance level (red shade) or below a support level (green shade). A bullish breakout above resistance suggests the potential for further price increases, while a bearish breakout below support suggests the potential for further price declines. Traders pay attention to these breakout signals as they may indicate the start of a new trend or significant price movement.
Disclosure: I am not SEBI registered. The information provided here is for learning purposes only and should not be interpreted as financial advice. It is important to consult with a qualified financial advisor before making any investment decisions. Tweets neither advice nor endorsement.

TATA MOTORS BUY TATA MOTORS BUY - Good Uptrend
Trade Reason :
1) Weekly Support
2) Day fib Level - 0.786
3)1 Hr - Trend Reversal Confirm . .
Entry - 980 Rs
Target - 1039 Rs
Stoploss - 915 Rs
Thank you ...

TATA MOTORS S/R for 7/5/24Support and Resistance Levels: In technical analysis, support and resistance levels are significant price levels where buying or selling interest tends to be strong. They are identified based on previous price levels where the price has shown a tendency to reverse or find support.
Support levels are represented by the green line and green shade, indicating areas where buying interest may emerge to prevent further price decline.
Resistance levels are represented by the red line and red shade, indicating areas where selling pressure may arise to prevent further price increases. Traders often consider these levels as potential buying or selling opportunities.
Breakouts: Breakouts occur when the price convincingly moves above a resistance level (red shade) or below a support level (green shade). A bullish breakout above resistance suggests the potential for further price increases, while a bearish breakout below support suggests the potential for further price declines. Traders pay attention to these breakout signals as they may indicate the start of a new trend or significant price movement.
Disclosure: I am not SEBI registered. The information provided here is for learning purposes only and should not be interpreted as financial advice. It is important to consult with a qualified financial advisor before making any investment decisions. Tweets neither advice nor endorsement.

Tata motors 1100 level loading Tata Motors gives a Breakout of Cup and Handle Patten and seems very strong on Chart and we can see 1100 level in Coming few months

Tata motors symmetrical triangle thingieSo it made a symmetrical triangle and broke upwards making it highly bullish in these cases the target and Stoploss should be the way demonstrated on chart ( Target should be the first/biggest swing in the triangle and stoploss should be the bottom of the last swing in the triangle before breakout

Triangle Setup In 1 day time frame...... Most probably closing will be on upside and then bullish (I am not a certified person, and this post doesn't encourage any investment advice, risk is all yours)

TATA MOTORS S/R Support and Resistance Levels: In technical analysis, support and resistance levels are significant price levels where buying or selling interest tends to be strong. They are identified based on previous price levels where the price has shown a tendency to reverse or find support.
Support levels are represented by the green line and green shade, indicating areas where buying interest may emerge to prevent further price decline.
Resistance levels are represented by the red line and red shade, indicating areas where selling pressure may arise to prevent further price increases. Traders often consider these levels as potential buying or selling opportunities.
Breakouts: Breakouts occur when the price convincingly moves above a resistance level (red shade) or below a support level (green shade). A bullish breakout above resistance suggests the potential for further price increases, while a bearish breakout below support suggests the potential for further price declines. Traders pay attention to these breakout signals as they may indicate the start of a new trend or significant price movement.
Disclosure: I am not SEBI registered. The information provided here is for learning purposes only and should not be interpreted as financial advice. It is important to consult with a qualified financial advisor before making any investment decisions. Tweets neither advice nor endorsement.

Head & Shoulders pattern inside Rising Channel in TATAMOTORSIf Neckline Breaks ,
-Immediate support is near 900 level
-Two possibilities to watch out from thereon:
1) Sharp reversal and Continuation of Uptrend inside rising channel (not respecting the neckline)
2) Deeper correction (around 820) if channel low broken

TATA MOTORS Support and Resistance Levels: In technical analysis, support and resistance levels are significant price levels where buying or selling interest tends to be strong. They are identified based on previous price levels where the price has shown a tendency to reverse or find support.
Support levels are represented by the green line and green shade, indicating areas where buying interest may emerge to prevent further price decline.
Resistance levels are represented by the red line and red shade, indicating areas where selling pressure may arise to prevent further price increases. Traders often consider these levels as potential buying or selling opportunities.
Breakouts: Breakouts occur when the price convincingly moves above a resistance level (red shade) or below a support level (green shade). A bullish breakout above resistance suggests the potential for further price increases, while a bearish breakout below support suggests the potential for further price declines. Traders pay attention to these breakout signals as they may indicate the start of a new trend or significant price movement.
Disclosure: I am not SEBI registered. The information provided here is for learning purposes only and should not be interpreted as financial advice. It is important to consult with a qualified financial advisor before making any investment decisions. Tweets neither advice nor endorsement.

TATA MOTORS S/R for 15/4/24Support and Resistance Levels: In technical analysis, support and resistance levels are significant price levels where buying or selling interest tends to be strong. They are identified based on previous price levels where the price has shown a tendency to reverse or find support.
Support levels are represented by the green line and green shade, indicating areas where buying interest may emerge to prevent further price decline.
Resistance levels are represented by the red line and red shade, indicating areas where selling pressure may arise to prevent further price increases. Traders often consider these levels as potential buying or selling opportunities.
Breakouts: Breakouts occur when the price convincingly moves above a resistance level (red shade) or below a support level (green shade). A bullish breakout above resistance suggests the potential for further price increases, while a bearish breakout below support suggests the potential for further price declines. Traders pay attention to these breakout signals as they may indicate the start of a new trend or significant price movement.
Disclosure: I am not SEBI registered. The information provided here is for learning purposes only and should not be interpreted as financial advice. It is important to consult with a qualified financial advisor before making any investment decisions. Tweets neither advice nor endorsement.

TATA MOTORS S/R for 12/4/24Support and Resistance Levels: In technical analysis, support and resistance levels are significant price levels where buying or selling interest tends to be strong. They are identified based on previous price levels where the price has shown a tendency to reverse or find support.
Support levels are represented by the green line and green shade, indicating areas where buying interest may emerge to prevent further price decline.
Resistance levels are represented by the red line and red shade, indicating areas where selling pressure may arise to prevent further price increases. Traders often consider these levels as potential buying or selling opportunities.
Breakouts: Breakouts occur when the price convincingly moves above a resistance level (red shade) or below a support level (green shade). A bullish breakout above resistance suggests the potential for further price increases, while a bearish breakout below support suggests the potential for further price declines. Traders pay attention to these breakout signals as they may indicate the start of a new trend or significant price movement.
Disclosure: I am not SEBI registered. The information provided here is for learning purposes only and should not be interpreted as financial advice. It is important to consult with a qualified financial advisor before making any investment decisions. Tweets neither advice nor endorsement.
