Sell Tata Steel, CMP 1290Tweezer top Bearish Candlestick pattern formed in Tata Steel. Sell for a quick gain. TP 1275
Selling volumes high in the box but no visible downfall, will refractor in eventually.
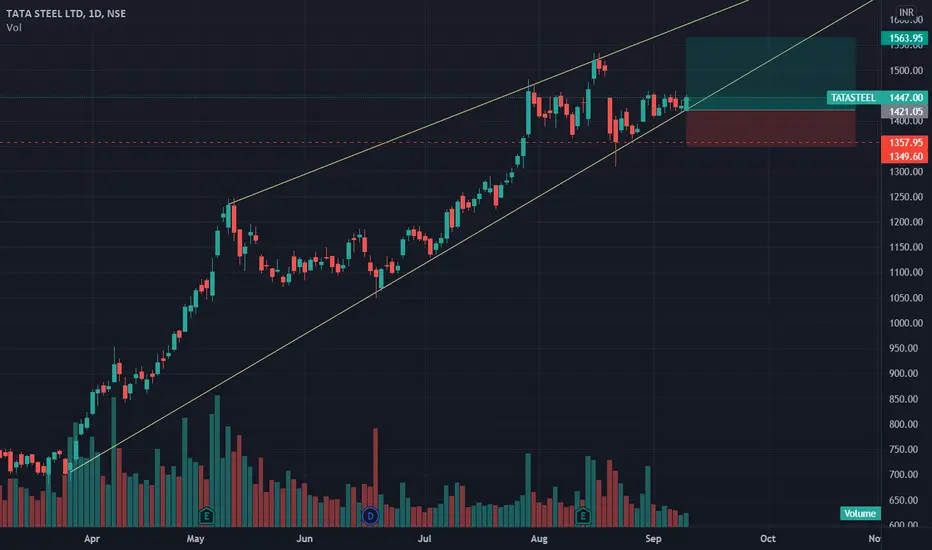
TATASTEEL trade ideas

Short with 1 % risk and Reward of 1:2Short with 1 % risk and Reward of 1:2
NOTE: You should not engage in trading unless you fully understand the nature of the transactions you are entering into and the extent of your exposure to loss. If you do not fully understand these risks you must seek independent advice from your financial advisor. All trading strategies are used at your own risk.

TATA Steel Inverted flag and pole pattern. Time frame: 1 Hour
Chart pattern: Inverted flag and pole pattern

tatasteel buy ideamonthly atr is 147 and previous month close was 1443, max correction to be 1296, but it has gone down more than that and currently taking support at 144 WDMA value 1260, is making a prz here where xabc done and d leg to form. and also AB=CD level coming at this area which might not extend more because since last 3 months this stock is doubling its upward journey speed during the expiry week after a sharp fall in the 3rd week.
buy should be initiated after a close above 1275, at least in a one hour chart for target 1, 1300 and target 2 1340 which is 8 dsma. view is negated a close below 1260 in daily chart and wait for 1180 or setting a stoploss at 1275 an aggressive short can be initiated for 1180.


Short Trade on Tata SteelTarget- 1190
Time Frame - 10 trading sessions
*************************************************
Head and Shoulder pattern has been formed on Tata Steel charts and the pattern has also been confirmed!
RSI is also around 40 which justifies the weakness in the stock.
MACD histograms are also justifying increasing weakness in the stock.
According to the head and shoulder pattern the stock must go to 1190 levels within 10 trading sessions.

TATA STEEL - Divergence asisted reversal of polarity1. Divergence with RSI on daily TF.
2. Still has not not broken the July candle range.
3. Look at the RSI. It has always taken an up thrust whenever it has come near the demand zone.
4. We have a similar formation in the stock this time.
The trend might reverse from here.
These are my insights. I can be wrong as well.

TATASTEEL range breakout post is for educational purpose only
short term pic
TATASTEEL showing consolidation now given a breakout
with good volume
go long
follow strict sl and manage risk as per your risk appetite

Tata Steel - Buy OpportunityTata Steel - Buy Opportunity
Entry: 1452
SL: 1444
TG1 : 1498
TG2: 1425
TG3: 1445

BREAKOUT IN HOURLY CHARTTata Steel taking support on trendline and broke the resistance with volumes, one can go long with SL at 1448

BULLS on TATASTEELHI!
Here we've got rising triangular, breaking resistance now.
Before we saw expanding triangular, so price is about to rise now!
Have a good trade!

TATA Steel Short Term ReversalThe stock has reached lower trendline and may undergo a reversal rally. Trade is supported by brokerage calls and Supports Nearby.
Risk Reward Ratio - 2:1
SL is placed below support zone & the lower trendline. The target is placed based on fundamentals.
Consolodating, Holding the levels.Tatasteel looking very very strong from here. Tomorrow could be trending day. SL 1407

Tata steelTata steel stock is in wave 5th of wave 3rd of the recent impulse till it ends, on daily charts, the most recent rally is ended in wave 3, as per theory,
both rsi and macd are showing bearish divergence in daily time frame, and this can also be seen in poor volumes and participations in metal stocks during the most recent rally, this is typical of wave 5 of some degree, as per scenario wave 4 depth of correction is marked near 1070 to 1100 range. it sounds hard but who knows we can go there if wave 3 comes to an end.
Key Levels are Mentioned on chart
Wave Structure and Volume
Rsi bearish Divergence in daily time frame
Macd bearish divergence in daily time frame
Creating bkt in daily time frame
Waiting for confirmation
Disclaimer
I am not sebi registered analyst
My studies are Educational purpose only
Please consult with your Financial advisor before trading or investing

Tatasteel Triangle BreakoutBuy or sell Tatasteel of it breaks either side with mentioned sloss & target

tata steel consolidation breakout causes further bull run 10%In range bound, breakout causes further upside, strong momentum.


Tata Steel ChannelTata steel has created a Channel in 30 min time frame and is expected to be in range


Fibonocci, Breakout @ 50 % lineWatchout.. LTP taking support and consolidating around Fionnoci 50% line , Trinagle Formation, Pull BAck after Touching Higher Highs.. Look out

