TATASTEEL trade ideas

Tata Steel - Intraday Trade SetupTATA Steel CMP - 492.20
Looking bearish in higher time frame. One can go for Intraday / Swing Trade setup with the following entry, exit & targets
Sell at or Below 489.50 / Stop Loss 496
Target 1 - 485
Target 2 - 480
Target 3 - 475
Disclaimer: This is my view and for educational purpose only.

TataSTeel Brekaout Setupprice break here with very good volume
Entry : 420 - 435
Stop : 340
Target : 480 , 535 , 600 , 680,750

Tata Steel PreparationTatasteel is ready to go after more than 2 years long downtrend. Key level 428.85 according dow theory. In last week average volume are very high. The upcoming week tatasteel and cnxmetal index can break key level. Keep watching.


tatasteelan bearish intraday trade expecting tomorrow on tatasteel.
candle end the rally after touching bearish trend line


TATA Steel - Which one of the Same Same will be repeatedTATA-STEEL - One CupnHandle formed in 2013-14 will be repeated or the huge fall in 2008-09-10 and recovery and cup n handle and then it fizzled out thru 2011-13....? Let us see....! Keep on radar. For now the Cup n Handle looks strong formation in near term...! Beyond 510 it can test 660 -680 also.!
Disc: Not a SEBI Registered. I post charts for my own study.

TATASTEEL - Intraday/Very short term SwingThis analysis is purely based on price action.
The analysis is on 15min TF hence target can be achieved in intraday trade or in couple of days
Trade strategy is explained in image itself. Don't run after the price.
Always plan your trade & trade your plan
Keep trailing SL accordingly once entered into the trade.
Trade at your own risk and money management
Feel free to comment for any queries & suggestion

TATASTEEL - Bearish H&S pattern (intraday/very short term trade)This analysis is purely based on price action & chart patterns
The analysis is on 15min TF hence target can be achieved in intraday trade or in couple of days
Trade strategy is explained in image itself. Dont run after the price.
Always plan your trade & trade your plan
Keep trailing SL accordingly once in trade
Trade at your own risk and money management
Feel free to comment for any queries & suggestion

TATASTEEL, The wedge is broadeningA steep broarding wedge. I will wait until price gets more near to a know level before posting a position. I am bullish on the stock IF it shows rebound at the $325 level and tries to retest the bearish trend line.
Use risk management as always.
Thank you for reading.

Tata Steel on Pull BackTata Steel LTF chart shows that it's been caught in a downward channel. Currently in a pullback. Long only above 421 else can see 370 levels again!


TATASTEEL Daily Two bearish BAT patterns
Within 3-5 price bars need Reversal with a Bearish candle + RSI BELOW 70 and with LOW VOLUMES thnen
POTENTIAL SELL.


Tata Steel - Looks Strong on Price StructureMonthly Chart
Stock has been in Triangle Structure for around 10 Years!
Stock has given breakout of this Triangle Pattern in 2017 Year and given around 250+ points rally.
Since Year 2018, it is in downside movement. This movement looks like a Pullback structure rather than a Bearish Trend (enough evidences to not consider as the Bearish Trend can be seen on the chart by relating it a long year triangle breakout.
It took the support as usual at the lower S&D area, please refer the chart where it has been marked with light-blue area.
Even before touching this S&D area, it has got good volume when its pullback was about to complete. It clearly shows strong participants in the stock.
Then as impact of Covid-19, we can see 3 back to back bearish WRC(wide range candles) but see the volume that looks less than previous volumes when price was moving up.
Seeing the structure as of now, we comes under impression that stock is clearly in mood of joining its Breakout-rally trend (Uptrend) after completing the Pullback structure.
Weekly Chart Study
NSE:TATASTEEL
Note:
- No Buy/Sell recommendation, only study and information purposes only.

TATA steel good short candidateTata steel spot cmp 420
Bearish BAT pattern formation
PRZ around 419 to 422 levels.
Rising channel patter :- counter is trading around resistance line of rising channel formation
RSI divergence :- price making higher and RSI making lower high,, bearish divergence..
AT cmp counter is good short candidate
Pattern violation above 433 levels on closing basis
Down side 400,,390.380 levels possible..

TATA STEEL - Large Cup N Handle AwaitingTATA STEEL - Looks like a Bigger Cup N Handle awaiting above 440. Let us See. Keep on Watchlist.

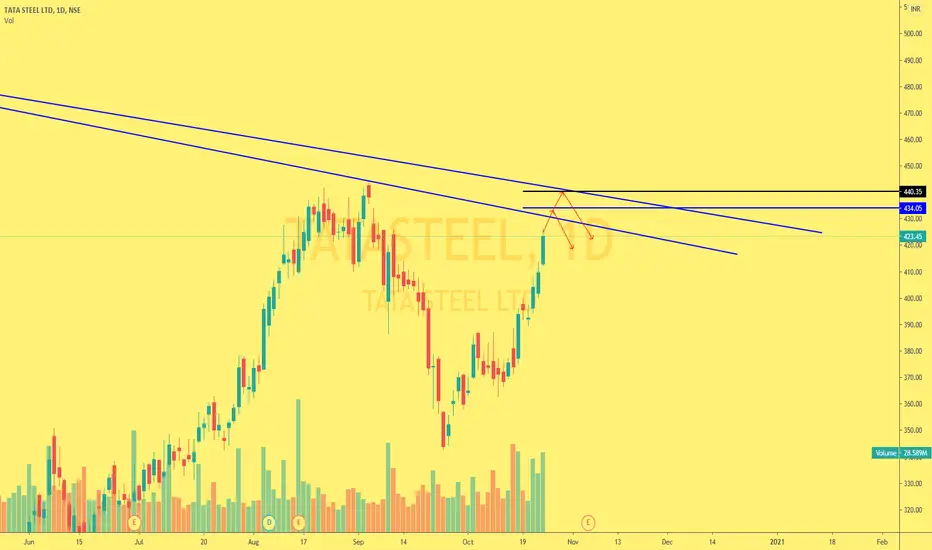
TATA STEEL INVERTED CUP AND HANDLE PATTERN (EDUCATON PURPOS)PATTERN IDENTIFYED AND LET SEE WHAT HAPPEN ONLY FOR EDUCATION PURPOSE

Intraday Pick for Monday 19th October 2020Nifty metal is given a breakout recently and the leader of the sector also has changed their move-in Upside. A good candidate for today's Intraday.
Tata steel
Buy: 396
SL: 390
Target: 401/406/410

