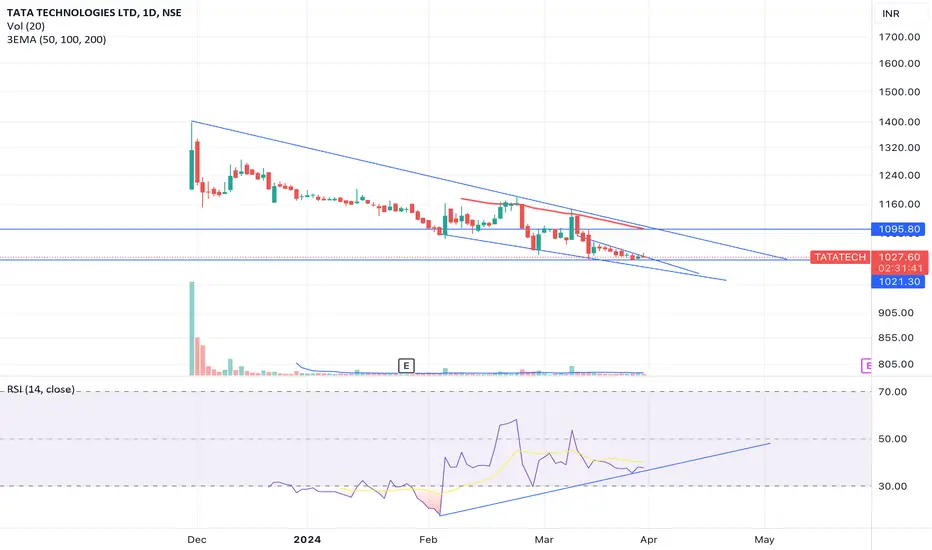
TATATECH DAILY CHART ANALYSISTataTech CMP@1114.70
Stock Trading Above All Major Averages
ADX Trending
RSI Bullish
RS Bullish
Pattern will Negate Is Closes Below@970
Headed Towards 1280-1350
TATATECH trade ideas

Tata technologies :- I am bullish on tata technologiesTata Technologies looking great it can touch its life time high 6to 12 month ,
My analysis is very Simple . I am using only price action support and resistance and keep things simple our target view is 17000-1800

Tata Tech - bullish reversalA small rounding bottom is also visible with first higher low after a long time, indicating a base & reversal is in making. Technically it looks good as long as 1030-1050 level is hold on daily closing basis, 1120, 1177 and 1230 are technical targets. Keep a view of 2 to 3 quarters.

another tata elxsi tata technoshowing reversal on weekly and daily chart...
fundamentals are great
great promoters
tata techno will be a leader in chip manufacturing in India
10k will be the target in 4 years

TATATECH1. Attractive at this price 1,066
2. Low risk and reward is expected
3. trendline break
4. we all knew, Tata is known for trust
5. Fundamentally strong.
and what else..... analysis and consider

Tata technologies2 Week high volume since IPO ,
Expect the stock to reach IPO price
Daily RSI above 60

Tata tech starting upwards journeyTata tech already formed a strong base at 960 and from there it has started upwards journey. First target would be 1100 and second would be 1250 . Fundamentals are good and at good levls for buying.

Tata TechEnter NSE:TATATECH at CMP, with an SL of 1010.
It seems that this gem from the Tata Sons empire is on the verge of an up-move in the coming weeks.
Those willing to hold it for longer horizons may hold it till a close below 971.4, post which must take an exit.
The formation of a reversal pattern post a prolonged downtrend, along with presence of a valid trendline with upto 4 touchpoints, makes this a significant breakout.
This may also be a good time to allocate to this stock, from a longer term standpoint.
**********************************************************************************************************************
This is for illustrative purposes only. Do not construe this as investment advice

LONGBreak out from this resistance can push the price upwards, volume too increasing. Significant revenue growth. Fundamentally looks attractive. It can be core portfolio stock. Rest your money your risk. Its not a buying suggestion.

TATATECH / LINEAR REGRESSION In the chart analysis, the linear regression channel developed by "LonesomeTheBlue" is being utilized. Currently, the price is attempting to breach the upper boundary of the channel. A close above this line today could provide further confirmation of a potential breakout.
Despite this, the downward-pointing red arrow suggests that the downtrend prevails, Therefore, it's crucial for bulls to maintain protective stop-loss orders.
Key support levels to monitor are at 1010 and 970. Additionally, the Fibonacci retracement levels highlight significant price points to watch closely.

Long Due - Tata TechSince the IPO listing this stock has been consistently on down trend, Now finally it has shown some strength and signs to start the up trend. Volume buildup + breakout on charts are seen. Brokerages recently has started coverage on this. More visibility will bring more buyers on this counter. Looking 1250,1300 targets.
->Good Promoter group
->Good RR
->Reversal Signs
->Volume build up
->SIP can be done in this stock with every dip this stock can be added.

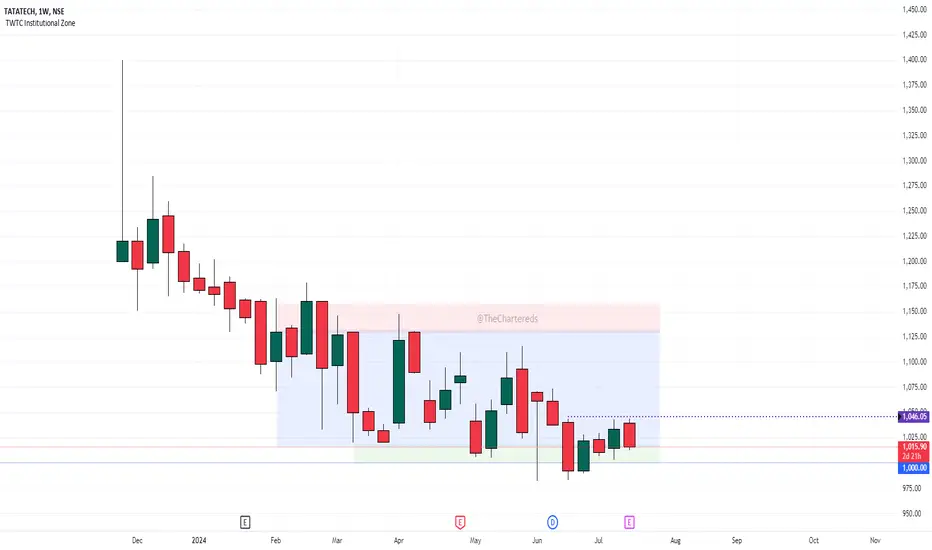
TATA TECH - Reversal on cards??🎯 The chart is self-explanatory as always.
🎯 A beautiful range-bound pattern
🎯 A strong reversal candidate
🎯 It will be interesting to watch once the price crosses the 1046 level
🎯 I like this price structure
⚠️Disclaimer: We are not registered advisors. The views expressed here are merely personal opinions. Irrespective of the language used, Nothing mentioned here should be considered as advice or recommendation. Please consult with your financial advisors before making any investment decisions. Like everybody else, we too can be wrong at times.
Tata Technologies Long term Better support been observed at 1000 area and there is a reversal pattern expected. the maximum it can go down is 800. recommended for long term buy.


TATA TECHNOLOGIESIncorporated in 1994, Tata Technologies Limited is a global engineering services company offering Product Development and Digital Solutions.
Market Cap ₹ 43,356 Cr.
Stock PE 69 against Industry PE 36
ROCE 28 %
ROE 23 %

TATATECHThese are swing ideas which you can add your watchlist and analysis for yourself !
Keep on your radar!

Breakout from Falling Wedges in TATA TECHTata Tech is breaking out of falling wedge pattern.
Entry: CMP
Stoploss: 1050
Target: 1250

Bullish on tatatech#TATATECH:
FALLING CHANNEL BO
If success to close above 1103 it will be fire up to 1200+ level
View invalidated if close below 1080


Tata Tech: Tata bye bye to Bears?The small falling wedge is about to break, RSI divergence is clear. Few good signs that are indicating bulls might be running into this counter. Confirmation will be above 1100 but I feel this may offer some good return from this point on, not recommended for a short term trade.
TATA TECHNOLOGIES + GANN SQ 144 + GANN SQ 9 TATA TECHNOLOGIES LTD is looking for support at 1020.
The GANN Square of 144 provides important support and resistance levels. The lines are running horizontal and vertical providing important levels. The GANN fan provides important intersections providing important levels to look for.
The GANN square of 9 provides support at 1010 and resistance at 1060 - 1110 - 1160 .

TATATECHPrice action and pattern suggest bearish sentiment
will look to short in a short term
fundamentals also over priced

TataTech BullishTime to Accumulate TataTech ..........
Bullish RSI Divergence on Daily Chart
7th March Green Candle with Good Volume
1200 is imp Resistance
Please Check Previous TA on Tata Tech
