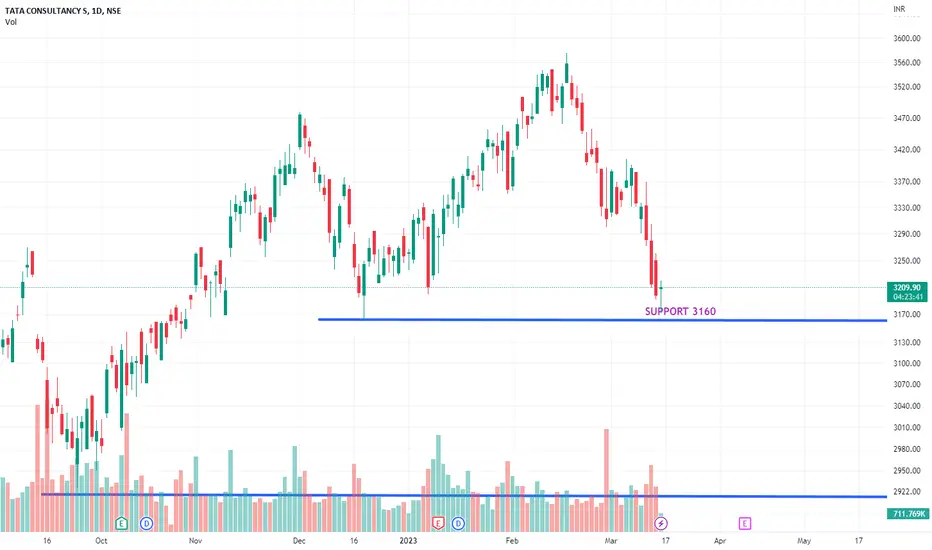
TCS around bottom time to accumulate this shareTCS around bottom time to accumulate this share. Stop loss below the red marked region. Open and close must be below to invalidate this setup.
TCS trade ideas

Flag and pole in TCSPrediction : Flag and pole are in the making in daily charts of TCS near an important support. Trade in the direction where it breaks. Less confident on the sell-side as there is another support very nearby. Swing trade on the buy side if the flag is broken on the upside.
SBIN and Bandhan bank predictions by me were spot on.

TCS READY FOR BREAKOUTTCS has formed an inverted head and shoulder pattern and has also broken the horizontal resistance. we can expect a good upside momentum and it can be taken as positional equity
low risk strategies such a bull put spread can also be explored
Note: this is for educational purpose only

TCS 15M (24TH MARCH 2023)NSE:TCS
4 Days consolidation in tcs
which works in a rectangle
which is called as box pattern .
will give good result
if gives oneside break.

Buy signal in TCS
Buy signal in TCS, but i think we should wait for a green candle on Monday before taking trade
TCS 1D 13TH MARCH 2023NSE:TCS
lets see it was in uptrend till 16th feb 2023.
but when below 3476 its in downtrend.
if buyers have energy then they will
uplift market
from 50% fib level.if they didnot ,
sellers will attack to take it downside.
it reversed from 60 % level,
it means buyers tried and did their work,
but again sellers are attacking .

TCS
THE IDEA WILL BE ONLY FOR STUDY PURPOSE .
wait for the breakout till then keep your eye on the stock .

TCS: Elliot Wave Completed !Folks,
TCS has completed the Elliot Wave and looking to trade sideways now. After which the real trend will be visible.
Wait for update!
- Knight_Kumar

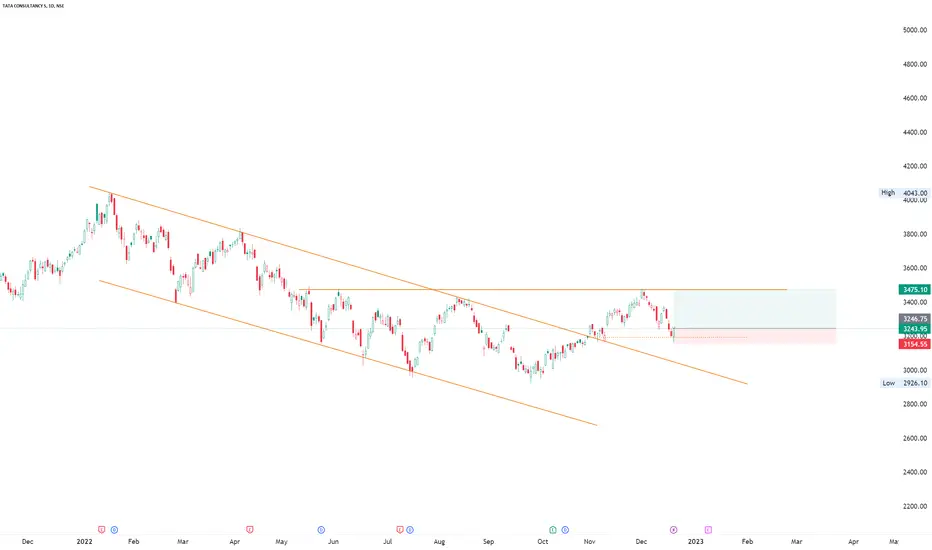
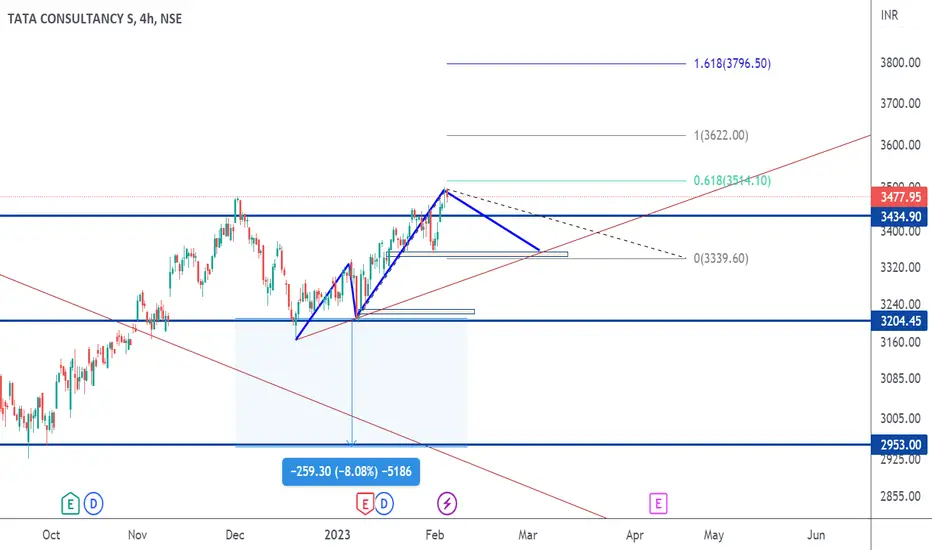
TCS Potential for Bullish Continuation | 21st February 2023Looking at the H4 chart, my overall bias for TCS is bullish due to the current price being above the Ichimoku cloud , indicating a bullish market.
Looking for a pullback buy entry at 3460.00, where the overlap support and 23.6% Fibonacci line is. Stop loss will be at 3163.65, where the recent swing low and 50% Fibonacci line is.
Take profit will be at 4043.00, where the previous swing high is.
Any opinions, news, research, analyses, prices, other information, or links to third-party sites contained on this website are provided on an "as-is" basis, as general market commentary, and do not constitute investment advice. The market commentary has not been prepared in accordance with legal requirements designed to promote the independence of investment research, and it is therefore not subject to any prohibition on dealing ahead of dissemination. Although this commentary is not produced by an independent source, FXCM takes all sufficient steps to eliminate or prevent any conflicts of interest arising out of the production and dissemination of this communication. The employees of FXCM commit to acting in the clients' best interests and represent their views without misleading, deceiving, or otherwise impairing the clients' ability to make informed investment decisions. For more information about the FXCM's internal organizational and administrative arrangements for the prevention of conflicts, please refer to the Firms' Managing Conflicts Policy. Please ensure that you read and understand our Full Disclaimer and Liability provision concerning the foregoing Information, which can be accessed on the website.

Intraday Long Opportunity in TCS.Long Opportunity in TCS for an intraday trade.
Reasons:
1. Breakout/Price sustaining above psychological level of 3500 will be a positive sign.
2. 200 EMA Support
3. NASDAQ currently at it's 200 EMA support on daily timeframe and should take a healthy bounce from here
NSE:TCS

TCS Tgt is around 4000 plus.Tcs has given a good pattern break into a new price range..tgt calculated as per pattern...CHART says stoplos entry and tgt
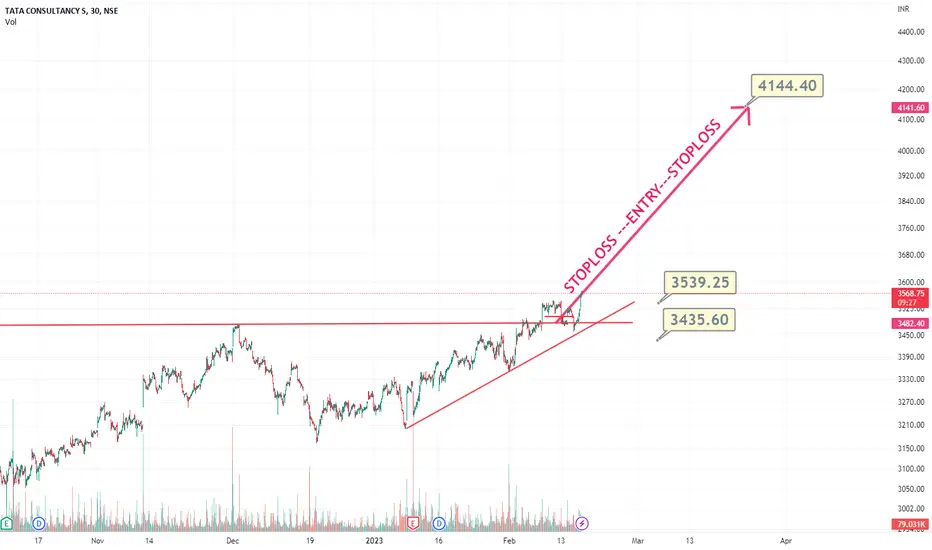
TCSNSE:TCS
In case of Gap down , pls ignore.
Risky Trade ! So don't bet a lot.
Note :
1.One Can Go long with a Strict SL below the Trendline or Swing Low of Daily Candle.
2. Close, should be good and Clean.
3. R:R ratio should be 1 :2 minimum
4. Plan as per your RISK appetite
Disclaimer : You are responsible for your Profits and loss, Shared for Educational purpose!

2023_NSE #1 TCS Buy for 3650-3800Good buying opportunity at important 3480 levels. Trade with SL. I am not SEBI registered; do your own analysis before investing.

#TCSAll IT Stocks has shown tremendous BO and still they have horizon to move further, watch chart for future targets and supports.

TCSDoes TCS is making head and shoulders pattern on weekly timeframe chart ??? I'm bearish if price comes below 3430 and Above 3500 sideways to bullish

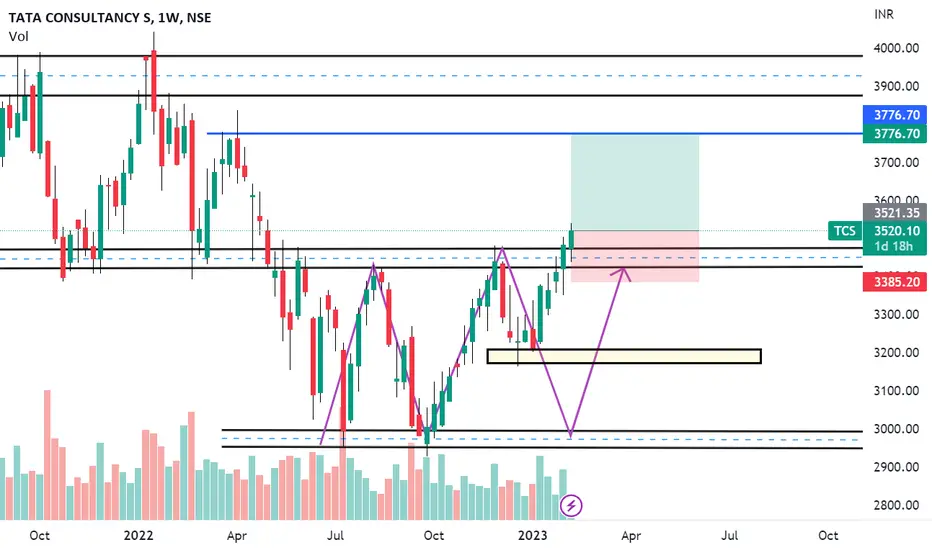
TCSTCS CMP 3520
chart speaks for itself ...
staying below red line,
Price can move towards blue line...
Just my small view!!
Vedang :)

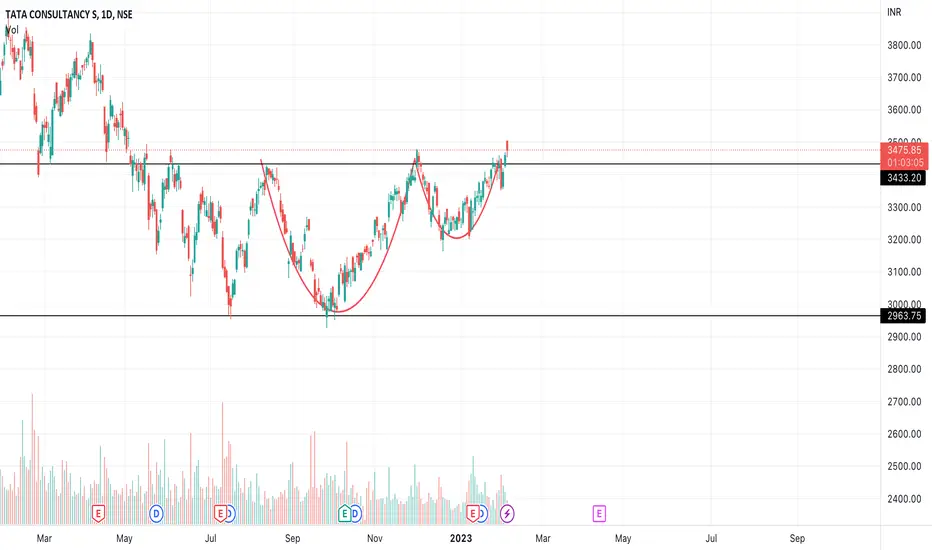
TCS Cup and Handle FormationCMP 3476
TCS formed a cup and handle pattern on the daily chart and broke out of a major resistance.
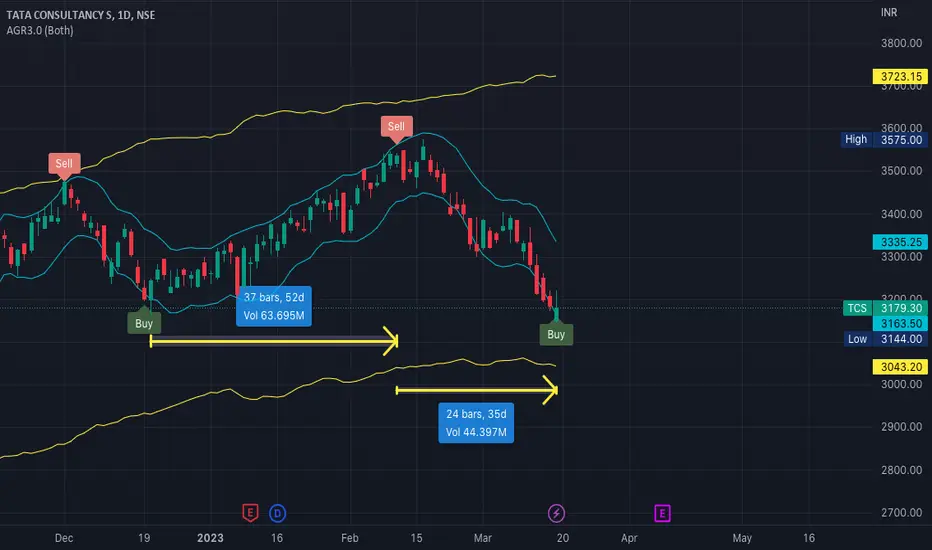
TCS looking for a run up Based on the GANN and astrology time price calculation it has entered to bullish zone, which is targeting towards 3725 by Feb end

TCS Cup And Handle Pattern.TCS Cup And Handle Pattern.
TCS stok already support level ...
breakout expect......
Disclaimer: Investment in securities market are subject to market risks, read all the related documents carefully before investing.
not buy or sell Recommendations
