TCS Trend AnalysisPrice is now at key support level.
Though the fundamentals are good, valuation is at a higher side.
Expecting IT INDEX to fall another 17% towards 25500 level, which may drive it low towards 2750 level.
Trendline support will provide confluence at that level.
Its better to accumulate around 2700-2800 level for the following targets:
1) Short term swing target @ 3400 (23.5% ROI with 3.25 R:R)
2) Medium term swing target @ 4000 (45% ROI with 6.25 R:R)
3) Long term positional target @ 5300 (92.5% ROI with 12.75 R:R)
Stop loss optional @ 2550
Do your own due diligence before taking any action.
Peace!!
TCS trade ideas

TCS trade set-up for short term | Long TCSHello traders,
India's Biggest IT company- TCS is a great stock for long term. Stock's behaviour is good for trading. Currently TCS trading on weekly support. It can be bounce back from here. We will get buy side entry on this stock(with great risk reward ).Levels and logic behind the trade explained on the chart.
Buy above:3645
Keep SL:3665
Targets:3740/3825/4000
Educational purpose only.


bullishshort term
entry : 3670
target:4000
use 50 ema
short term
entry : 3670
target:4000
use 50 ema

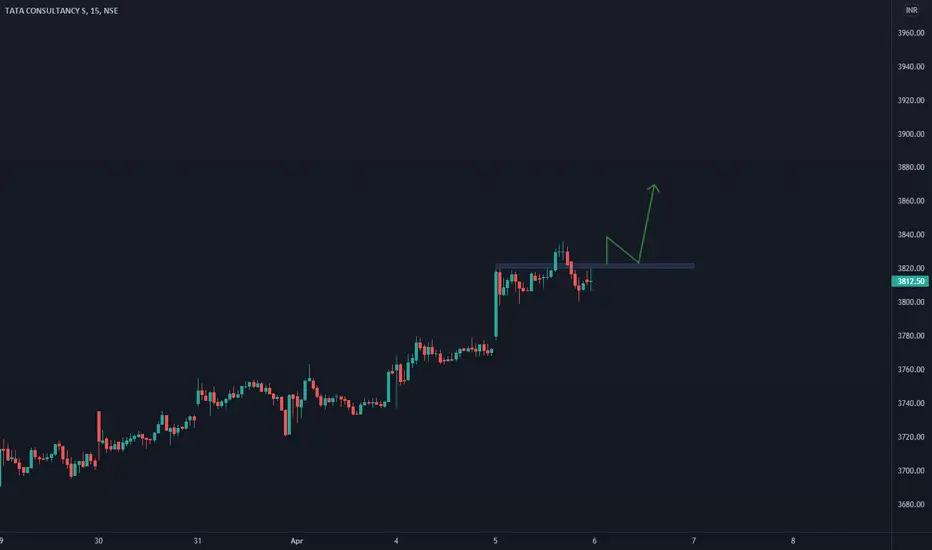
TCS Trade Setup in 15 min Time FrameTCS Trade Setup in 15 Min Time Frame
#sharemarket #stockmarket #trading #intraday#sharemarketindia #sharemarketnews #sharemarkettips #indiansharemarket #trading #forextrading #daytrading #tradingcards #cryptotrading #tradingforex #bitcointrading #swingtrading #binarytrading #sharemarketindia #sharemarketnews #sharemarkettips #indiansharemarket

TCS analysisThere are two cases for TCS on HTF!
Case -1
Right now it broke downtrend and retested 0.382 fibo level nicely if it broke then we will retest 0.236 fibo level or else we will see any time reverse from these two levels!
Case-2
As we can see that it is forming inverse H&S and sitting on top of 2nd shoulder if it will reverse from there and breaks the Neckline then it will retest the neckline and it will go upwards!
Right now-
OBV broke downtrend and retesting the trendline
RSI is sitting at good support of 40-41


TCS BREAKOUTIF ITS CROSS THE UPPER TRADELINE WE SHOULD GO BULLISH trade and next is low tradeline break than we are going to down side trade.
have a great day to all thank you

TCS buy for intraday tradingTCS buy for intraday trading if stock and IT sector also strong then we will enter in stock..........
TCS IndiaSun Storm Investment Trading Desk & NexGen Wealth Management Service Present's: SSITD & NexGen Portfolio of the Week Series
Focus: Worldwide
By Sun Storm Investment Research & NexGen Wealth Management Service
A Profit & Solutions Strategy & Research
Trading | Investment | Stocks | ETF | Mutual Funds | Crypto | Bonds | Options | Dividend | Futures |
USA | Canada | UK | Germany | France | Italy | Rest of Europe | Mexico | India
Disclaimer: Sun Storm Investment and NexGen are not registered financial advisors, so please do your own research before trading & investing anything. This is information is for only research purposes not for actual trading & investing decision.
#debadipb #profitsolutions


SMA & EMA 50,100,200,300Exponential Moving Average (EMA) & Simple Moving Average (SMA)
50 DAYS
100 DAYS
200 DAYS
300 DAYS

TCS Following FibonacciTata Consultancy Services moves in a channel upwards, then retraces, exactly to 78.6% basis Fibonacci.
If TCS makes a recent top, you can get short opportunity all the way down to 78.6% irrespective of what NIFTY IT does.
Wait for the top, and breakdown from channel before entering trade. Keep trailing stop loss after every day.


TCS heading toward upward journeyTCS has took strong support on near 3385 level and also given a trendline breakout. As RSI also indicating strong upside and crossed 34 DMA. Upside can be seen in upcoming sessions and reach its resistance level.

TCS TRENDLINE RESISTANCETCS trend-line which earlier was a support for the stock is now acting as a resistance with 2 open= high at the trend-line in last few days.


TCS to move higher?TCS has crossed above the long term trendline. If it closes above 3665-3670 levels, we can expect it to move higher

TCS Good Zones For #Bottomfishing Best Buy Zone: 2889 - 3398
Good Buy Zone: 3398 - CMP
Add on bounce, not while it is falling.
Long Term Portfolio Stock.
Tracking Quantity can be taken at CMP. (Tracking Quantity : Suppose you want to Invest Rs.X in a particular stock. The amount between Rs.X/5 or Rs.X/10 would be tracking quantity) (‘Tracking Quantity’ of a stock in your portfolio will help you keep a track of the stock if it is coming in the indicated buying zones.)(Sometimes Out of sight goes out of mind so buying tracking quantity of stocks that you want to add in future helps.)

TATA CONSULTENCY TCSTCS taking support in daily time frame its a good time to buy , entry point above 200 moving average think as a investor

TCS TCS broke a major trend line and rebounded after touching a major support line. If it moves above the trend line we can expect it to reach the recent highs. If it breaks down below the support line it is expected to lose another Rs100-200.

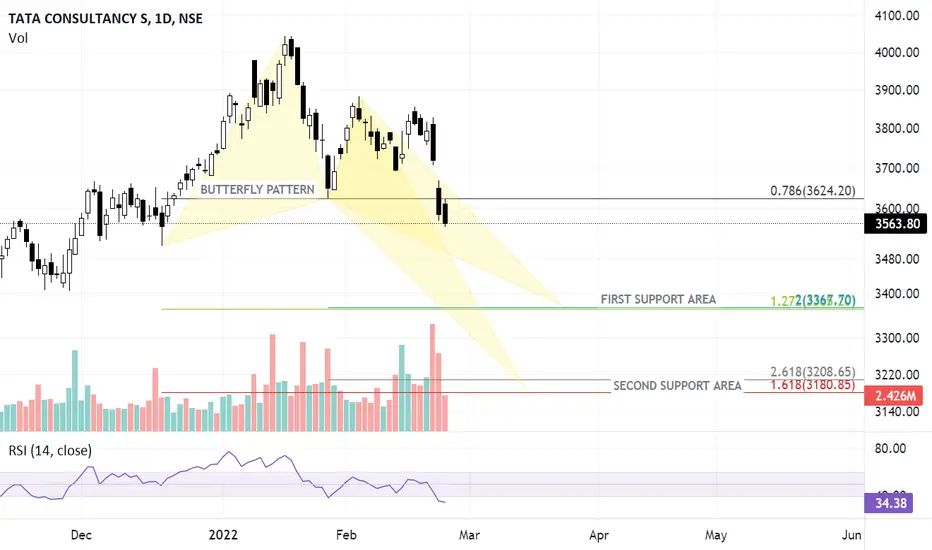
TCS HARMONIC LEVELS FOR POSITIONAL TRADINGTCS is currently in a correction mode, and it is likely that we may see further weakness in the stock, and stock could move lower to 3400 to 3200 levels in the near term.
This is a great stock for Investment and for positional trading also.
I can see butterfly pattern formation on its daily chart, which is suggesting a good support area around 3400 -3367 levels and at 3180-3208
Stock can be bought in tranches as both of these levels can be seen in the stocks.
Disclaimer: Not a recommendation to trade.
TCS 1DTCS currently at the bottom of a crucial zone. It can give a good move either side.
If it breaks down expected target can be around 3100.
If reverses from this zone one can expect a target of 4050+
Trade safe. Manage risk. Be profitable.
Please follow us for more simple trading analysis and setups. Also let me know in the comment in case you have any queries.
Disclaimer :- This is just my view. Please analyze charts yourself and then decide to take any trades.
