Rounding bottom with increased volume, a BO candidateTCS forming rounded bottom and increase in volumes. Preferably a BO candidate with target around 3100
TCS trade ideas


TCS 4HRBearish BAT with Top Reversal is a two bar Sign Of Weakness. First bar is widespread up bar closing on/off the high with high volume supply swamping demand or low volume-no demand. The high and the close are higher than the previous few bars. The second bar is widespread down bar closing on/off the low on higher or lower volume than the first bar
AS second bar close & low are lower than the first bar low, on volume higher than the first bar volume, it shows effort to go down is successful and if second bar high is higher than the first bar high it shows additional weakness. It shows immediate weakness (Effort vs Result) & can be traded immediately on first No Demand or Up-thrust.
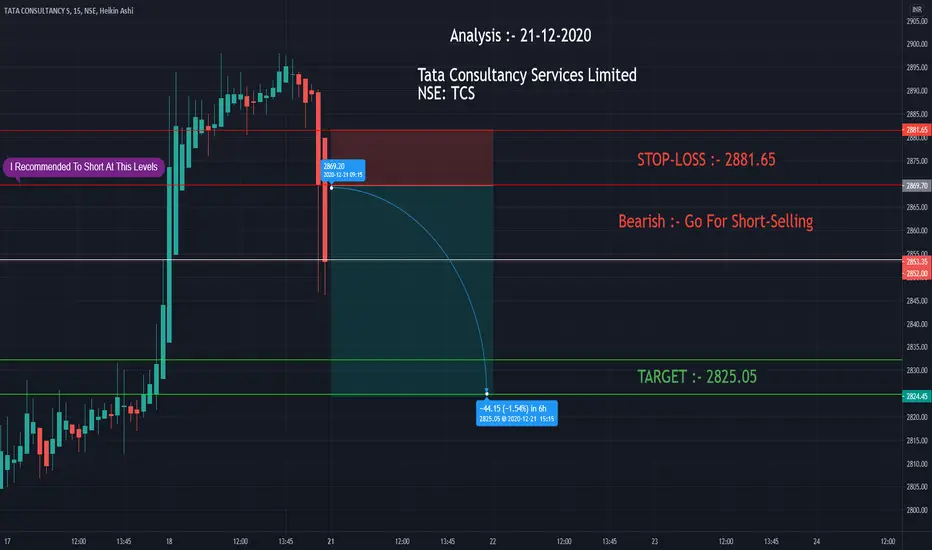
POTENTIAL SELL


Buy on Dips until Big fund Manager (FII's) has Long on this.As we all Know that this a very heavy weight stock, which is one of a favorite stock of FII's and also a Nifty's Ride, So the Idea is, while FII's is a buyer try to buy every dip. In an Intraday, try to catch on 40 RSI in 15 min. chart and as same for Positional in 1 Hr. chart. But for Intraday we can Sell Below 2838-2804= for 34 points.

TCS 4HRBEARISH BAT
price need to follow Green Trend line & hit target
If price Breaks Red Trend line is where EXIT before SL hits
POTENTIAL SELL


TCS is bullish should buy from daily trendline supportTCS is bullish should buy from daily trendline support

TCS 2.0Nice chart formation, and a consistent move in the channel. After some consolidation looking good for 3K this time !!

TCS Shows the Bull Run PromiseThe LAST CLOSE PRICE of NSE:TCS is 2797.3 . The PARABOLIC SAR is showing the UPWARD SIGNAL with TREND as UPTREND . The FIBONACCI LEVELS analysis shows that the CLOSEST FIBONACCI LEVELS is 0.618 at the FIBONACCI STOCK PRICE LEVEL of 2776.15 . From here, the Key Support and Resistance levels are SUPPORT 1 at 250.07 , SUPPORT 2 at 2708.5 with RESISTANCE 1 and RESISTANCE 2 at 2824.02 and 2885 respectively. The Key 50% FIBONACCI LEVEL stands at 2742.53 which is the crucial Fibonacci Level determining whether the scrip will maintain the trend or not.
The STOC RSI has the values K and D as 84.09 and 76.33 respectively. At this level it the status is OVER BOUGHT . When we look at the Moving Averages , MACD is the crucial indicator to look into. With MACD VALUE at 26.34 and at 19.74 alongwith HISTOGRAM showing valus of 6.6 , the STATUS is clearly UPWARDS .
The best indicator to determine the Trend Reversal is FISHER TRANSFORM and currently the values of FISHER and TRIGGER stand at 1.55 and 1.31 with as TREND CHANGED TO BUY . A very important factor while making the investment is to see if there has been already too much of Buying or Selling, and that are we entering too late into the transaction or not. Thus, with WILLIAM's R% value at -0.0416 the STATUS is OVER BOUGHT .
No one wants to buy costly things, and thus always look for the bargain or appropriate price levels to buy things. The same applies to Stocks, however the only exception would be some Hot Stocks that one wants to have any price. Looking at this perspective, the P/E RATIO of the stock stands at 34.246 which signifies its Price Level to be TOO EXPENSIVE .
>>> TREND is : BULLISH."
Disclaimer:
The analysis is only for illustration purposes only. Please consult your financial advisor, agent, broker before acting on any information. We may or may not have positions in the stock and our actions may be contrary to the one mentioned here. This analysis may or may not be updated. We would not be responsible for the profit/loss resulting from this analysis.


TCS - Pennant BreakoutTCS given pennant breakout, a resistance above which need to be broken for upmove,Targets on chart...
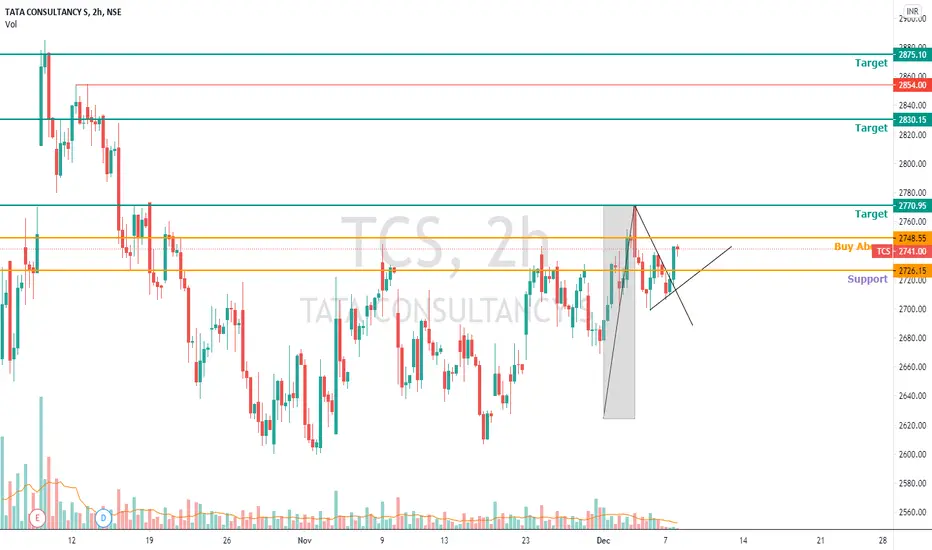

TCS - Intraday / Swing Trade SetupTCS CMP - 2737.70
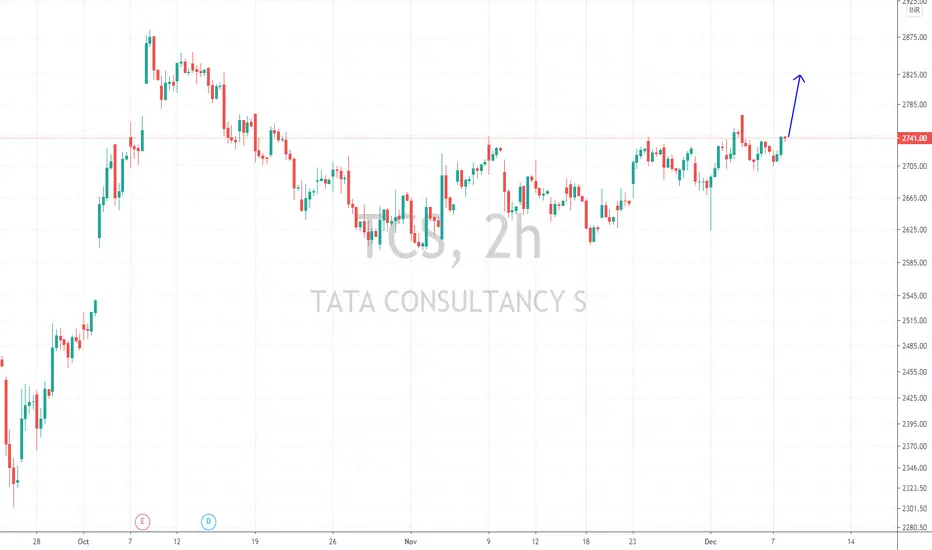
Looking bullish and range breakout in higher time frame. One can go for Intraday / Swing Trade setup with the following entry, exit & targets
Buy At or Above 2743 / Stop Loss 2730
Target 1 - 2753
Target 2 - 2763
Target 3 - 2775
Disclaimer: This is my view and for educational purpose only.
TCS - Reverse Head and ShouldersTCS has been respecting the range proposed in the last idea. Still waiting to see closing above 2744 for a significant upside.
However, we can see formation of a reverse head and shoulders pattern at the resistance line of 2744. This means a breakout on closing basis shall take the stock up fast.

TCS (Breakout Ready ?)TCS has formed a god consolidation pattern and might breakout in this week. Markets support will be required for it to continue.

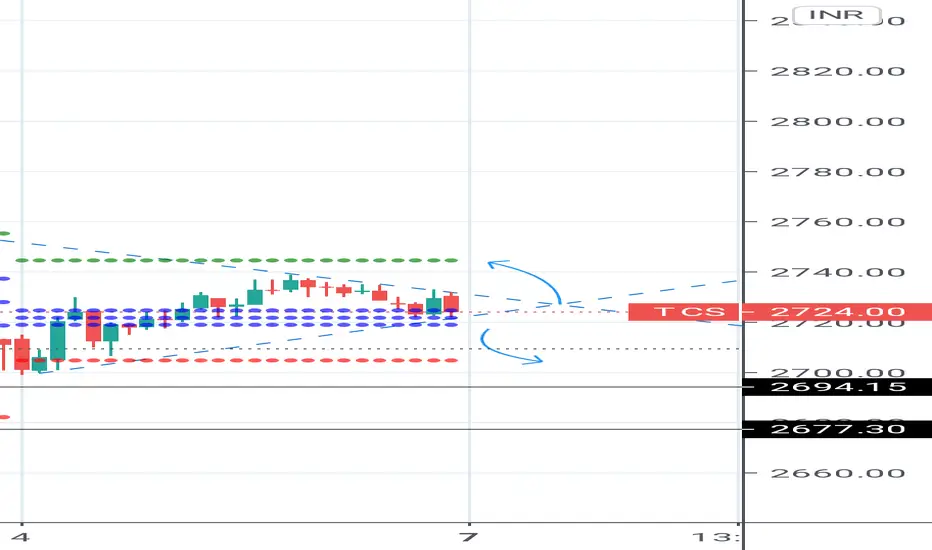
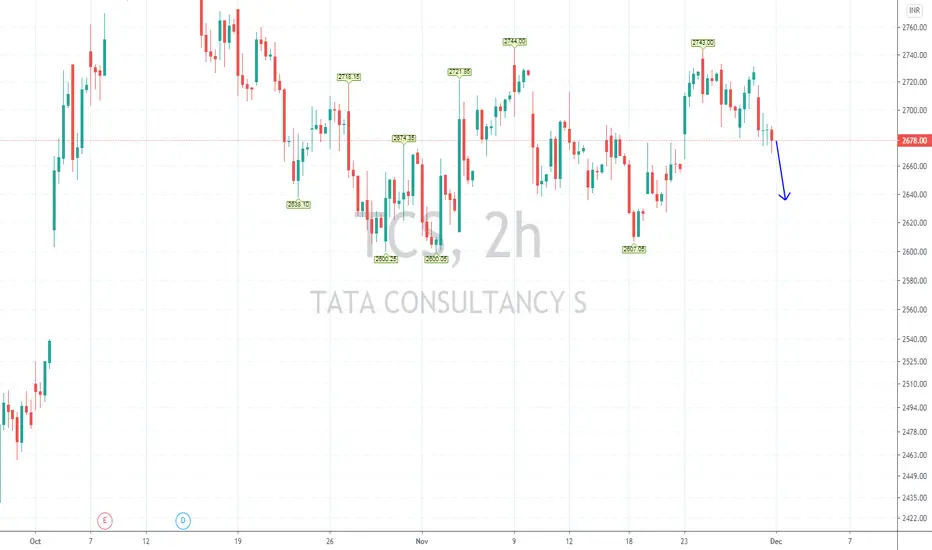
TCS - Intraday / Swing Trade SetupTCS CMP - 2679.65
Looking bearish in higher time frame. One can go for Intraday / Swing Trade setup with the following entry, exit & targets
Sell at or Below 2678 Only / Stop Loss - 2692
Target 1 - 2668
Target 2 - 2658
Target 3 - 2648 / 2635
Disclaimer: This is my view and for educational purpose only.
TCS - December of Sideways MovementAfter a commendable run post good results and buy back. TCS has moved back into its upwards channel and is not consolidating with support of the gap created on Buyback news.
December month is good option to sell calls of 2750 and take long positions on closing above 2750 for 3000 levels.


TCS Long Swing Trade - Bullish Flag in 1 hour chartHi Swing Traders,
Good TCS bullish flag structure. Possible 5-6% Target with a small Stop Loss of 2%. More explanation in the chart
I hope you will benefit from this knowledge.
-MetaVish

TCS - Breakout & Retesting (Bull Flag & Double Bottom) - SwingThis analysis is purely based on price action and chart pattern.
Analysis is done on daily TF hence it may take several days to couple of weeks to reach its target. Traders can also take advantage of this analysis in intraday trades.
Trade Strategy along with logic is explained in image itself.
Always plan your trade & trade your plan
Keep trailing SL accordingly once entered into the trade.
This analysis is purely for education purpose. Kindly do your own study before entering into any trade .
Feel Free to comment for any query and suggestion.
