possible 4th wave in progress or 5th wave started in TechMseems like 123 waves are over and 4th wave is in progress or the 5th wave has started
TECHM trade ideas

After 13 months of consolidation !! TechM is breaking the rectanAfter 13 months of consolidation !! TechM is breaking the rectangle zone !!

Tech Mahindra range breakout pre-emptingtech mahindra in range from 22 august till now 28 june 2023
range is 999-1142 it has touched boundaries and the fall and rise happened
recent fall reverse from 1060 so i think now range breakout can happen
cmp 1108 sl 1060 above 1142 confirmation will be there
target 1284 and 1426

TECH M! Retest and Continuation?? Tech Mahindra has been consolidating for quite a while now. just as with any other cream IT Company, looks like it's gearing up for some momentum.
It formed a beautiful symmetric triangle breakout and is now in a retest mode. A continuation of that breakout can trigger some good momentum.
Also, check out our opinion on the overall IT Sector.
What do you think??
If it was worth your time, do give us a like. Anything on your mind? Feel free to leave us a comment :)
DISCLAIMER: WE ARE NOT ADVISORS. WE ARE NOT REGISTERED. THE IDEAS ARE MERELY PERSONAL OPINIONS. PLEASE CONSULT YOUR FINANCIAL ADVISORS BEFORE INVESTING. WE, LIKE EVERYBODY ELSE HAVE THE RIGHT TO BE WRONG :)

Fake BO in TECHM??!!!TECHM gave a breakout from the range and marked the price 1271 and trading back in the range looks like a Fake BO scenerio. I'll be accumulating it on every dip. For long position let it cross 1271.

Double Top breakdown in techmahindraTECH MAHINDRA
Key highlights: 💡⚡
✅On1hr Time Frame Stock Showing Breakdown of Double Top Pattern .
✅ Strong bearish Candlestick Form on this timeframe.
✅It can give movement up to the Breakdown target of 1070-.
✅Can Go short in this stock by placing a stop loss above 1150+.

Tech Mahindra is on a breakout from the rectangular patternTech mahindra is retesting the rectangular pattern and it about to Explode !
Buying range - 1150-1160
SL - 1070
Target - 1360 , 1575
with a great risk and reward ratio of 1: 5


Buy opportunity for Tech Mahindra Tech Mahindra consolidated and created leading diagonal pattern in it's first wave.
After completing it's first wave of the second wave - it has retraced back to 61.8%.
A good opportunity to buy with stop loss of 1035 and target of 1333

Golden ratio As result are near and dividend announced so operator made it down .
Good is not bad fundamentally.
Technically you all can see on the chart .
And support also there
I'm sharing educational experience.
Trade as per your plan

Tech Mahindra - Intraday BuyTech M is ready to cross 1300 and second target 1325.
SL 1230
Uptrend retracement after golden Fibo level.

OUT OF BOX: IDEAScript name: Tech Mahindra (TechM)
Stock out of Box Consolidation
CMP 1248
TGT 1300-1350-1420++
Sl can be placed below 1200
Note : Just n idea not any personal recommendations for buying or selling of the particular mentioned stocks..

techm ready for the blast 1 year of range breakouttech from last 12 month in same range now last 2 month it gives us strong green close so don't miss this best upcoming move expected 200 to 300 points move from this level above 1165

Tech Mahindra looks strong for positional tradeNifty IT index which was mute for quite sometime is showing strength again. One of the stock which has the potential to give solid return is TechM. On weekly timeframe, the stock has given clear breakout last week followed by good amount of volumes. RSI is showing strength as it has crossed above 60. Any dip can be a good buy. Stock can go all the way till all time highhigh which is around 48% from the current price.

Tech Mahindra Stock range breakout after long consolidation.
Price above 20 50 100 200 DEMA.
Desclaimer- only for education purpose.
Don't recommend any buy or sell call this stock.

TechMstock was rangebound for 1 year. Major player in AI technology. upside levels marked. no SL as every 100 pts dip must be added. Positional Pik only

TECHMAHINDRA - BOX CONSOLIDATION BREAKOUT PLUS 200 MA SUPPORTTECHMAHINDRA
Everything is clearly mentioned on the chart it self.
BOX CONSOLIDATION BREAKOUT PLUS 200 MA SUPPORT ON WEEKLY CHART.
As I am writing this the market is highly bullish and global market sentiment is also highly bullish.
Thank you.
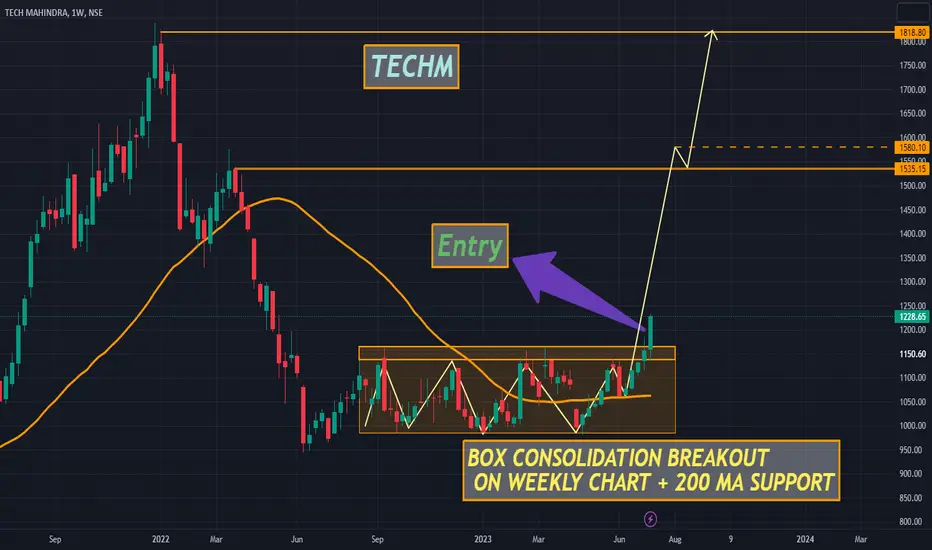
Chart of the week!Tech Mahindra has formed head and shoulders and given breakdown somewhere in April. Since then the stock is in down trend and corrected around 48% since its all time high . In last few months, however, it has successfully done consolidation and make a bullish wedge trend reversal. It came to my attention last week, however, the breakout was not looking sustainable. This week it has confirmed then breakout, hence, I am recommending it for medium to long term investment. Now we can expect the up trend and eventually it should test it's all time high again.
The CNX IT index gained whooping 4% or 1300 points in today itself so I am very much positive on the whole IT stocks. An Investor should keep a deep stoploss of 1000 as the company has a reputed management.
CMP - 1228 (14/7/23)
T - 1370, 1800 W
SL - 1125 W

Tech Mahindra Ltd57 weeks Consolidation
980 - Strong support
Targets in chart
Market Cap
₹ 1,14,358 Cr.
Current Price
₹ 1,174
High / Low
₹ 1,175 / 965
Stock P/E
23.7
Book Value
₹ 287
Dividend Yield
2.74 %
ROCE
22.5 %
ROE
17.6 %
Face Value
₹ 5.00
Promoter holding
35.2 %
EPS last year
₹ 49.6
EPS latest quarter
₹ 11.5
Debt
₹ 2,740 Cr.
Pledged percentage
0.00 %
Net CF
₹ 267 Cr.
Price to Cash Flow
20.5
Free Cash Flow
₹ 4,603 Cr.
Debt to equity
0.10
OPM last year
14.6 %
OPM 5Year
16.6 %
Reserves
₹ 27,484 Cr.
Price to book value
4.12
Int Coverage
20.8
PEG Ratio
4.04

TECH MAHINDRA 1D TIMEFRAMETECH MAHINDRA 1D TIMEFRAME,
tech mahindra 1D timeframe analysis, see this chart and watch this level.
almost 411 days techmahindra is range so brackout time coming soon wait this level brack.
Resistance- 1140-1162 Is Resistance Zone.
Brake Resistance zone
Next target- 1301 TO 1330
open your eyes bcoz net target is boom so mark your chart this level.
happy trading

Tech Mahindra : What's Next for the IT Giant?The Tech Mahindra stock price has been consolidating in a range for the past few months. However, the recent price action suggests that the stock is poised to break out to the upside.

Tech mahindra signal bullish breakout, Symbol: Tech Mahindra (TECHM) Timeframe: Daily
Technical Analysis:
Since May 25th, the price of Tech Mahindra (TECHM) has been exhibiting a sideways price action, consolidating within a defined range. This period of consolidation can be seen as a sign of accumulation. The stock has formed clear support around 1015 Rs Peventing any substantial downward movement. Similarly, resistance has been established near 1149 Rs capping the upside potential for the time being.
The prolonged sideways movement suggests a build up of energy within the stock, hinting at a potential breakout in the near future. Traders and investors should keep Tech Mahindra on their radar for a potential bullish breakout.
Key Observations:
Sideways Price Action: Tech Mahindra has been trading within a range since May 25th, with limited upward or downward movement.
Support and Resistance Levels: Notable support has formed near 1015 while resistance is holding firm around 1149
Bullish Breakout Potential: The current sideways price action suggests that the stock is accumulating energy for a potential breakout to the upside.
Trading Strategy:
Given the possibility of a bullish breakout, traders can consider the following strategies:
Breakout Entry: Enter a long position once the price closes above the resistance level 1149 This would confirm the bullish breakout and potentially lead to further upward momentum.
Target Levels: Consider setting profit targets based on key resistance levels or by using technical indicators such as Fibonacci extensions or previous swing highs.
Disclaimer: This analysis is for informational purposes only and should not be considered as financial advice. Trading stocks involves risk, and it is important to conduct thorough research and analysis before making any investment decisions.

Swing Trade opportunity in TechMahindraAnalysis: 1 hour Range breakout in TechMahindra. Also the stock has closed above 200Ema on daily candle close.
One can trade as per the long position mentioned on the chart with 1:2 Risk Reward Ratio.
Note: This information is for entertainment purpose only and please do your own research and consult your financial advisor prior to taking any action.
If you like this Idea, Please do like my ideas and share it with your friends. To further connect check my bio.
Please boost my ideas and send cheers as it acts as a motivation to keep posting my analysis.
Thank you
