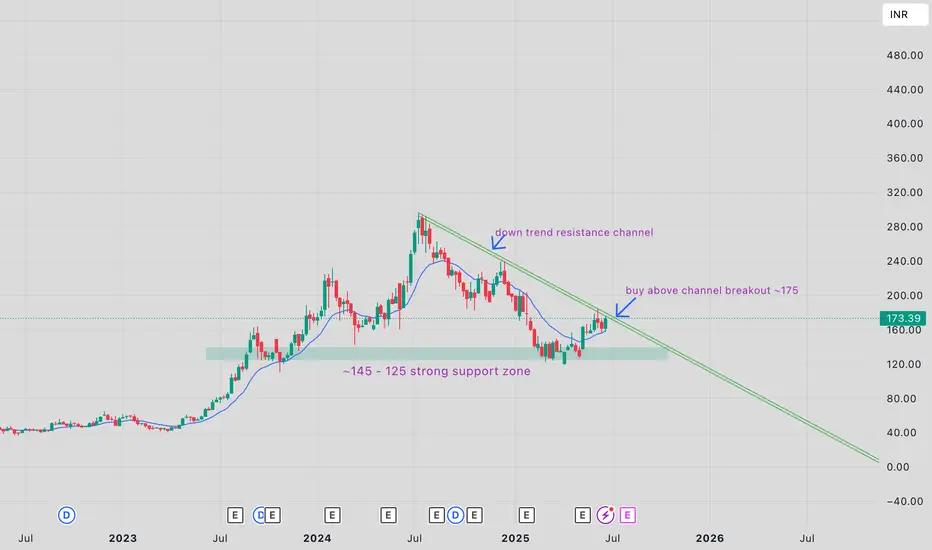
TEXRAIL-EQ is nearing breakout and will likely retest its highindian railways theme is again picking momentum. if we check charts of railway theme like IRFC, RVNL etc, barring couples, almost all are nearing breakout.
once breakout is given the price is likely to retest its high and in some cases will make a new high.
one such company is TEX RAIL. price is trying to take support at its strong support zone and is consolidating at those levels. price is at value zone and will eventually breakout.
safe players are advised to buy above the resistance channel breakout for minimum risk.
as always people are advised to trade as per their risk capacity.
TEXRAIL trade ideas
TEXRAIL | Buy @LTP | SL below 152 | 1st Target 200, 230Disclaimer:
This is not financial advice. Please do your own research or consult with a financial advisor before making any investment decisions. Investments in stocks can be risky and may result in loss of capital.


TEXRAILi Observed these Levels based on Price Action and Demand & Supply which is my own Concept "PENDAM CONCEPTS"... Please don't take any trades based on this chart/post... Because this chart is for educational purpose only not for Buy or Sell Recommendation... Thank Q

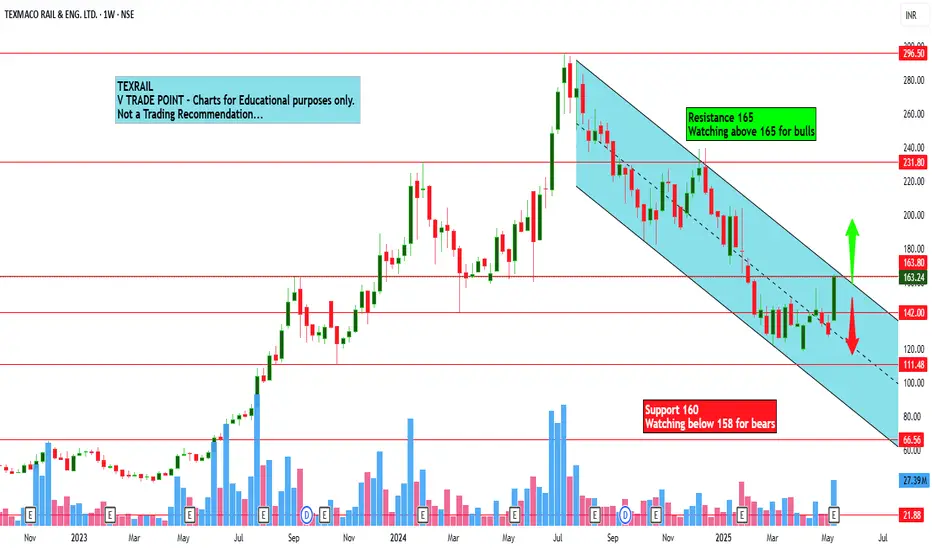
Texmaco Rail & Eng. Ltd view for Intraday 19th May #TEXRAILTexmaco Rail & Eng. Ltd view for Intraday 19th May #TEXRAIL
Resistance 165 Watching above 165 for upside momentum.
Support area 160 Below 160 ignoring upside momentum for intraday
Watching below 158 for downside movement...
Above 165 ignoring downside move for intraday
Charts for Educational purposes only.
Please follow strict stop loss and risk reward if you follow the level.
Thanks,
V Trade Point
TEXRAIL : What is after Sharp Decline?
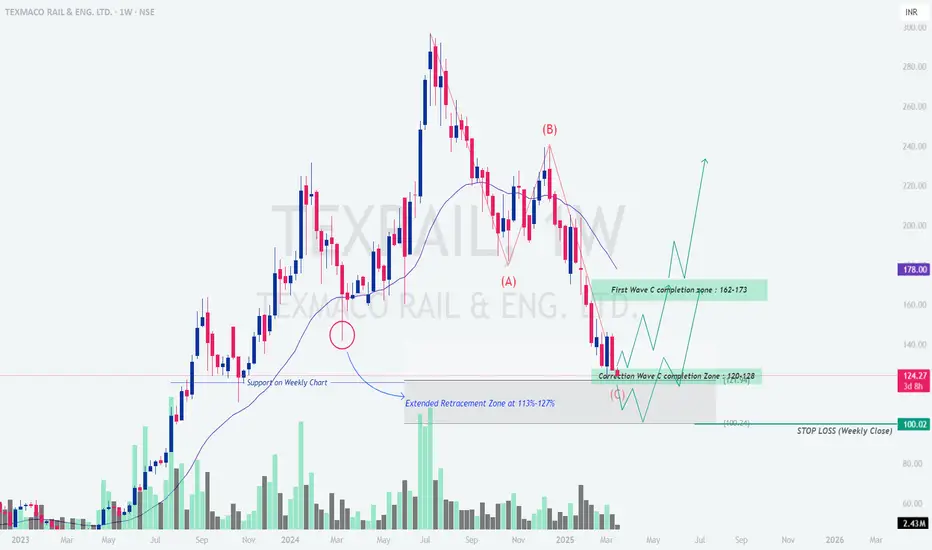
TEXRAIL: Elliott Wave Analysis - Weekly Chart
Source: LiveTradingBox | Chart Date: March 18, 2023
Overview
Texmaco Rail & Engineering Ltd. (TEXRAIL) rallied from 60 INR (early 2023) to 280 INR (mid-2024), a 366% gain , but has corrected to 124.27 INR. Using Elliott Wave and Fibonacci, this analysis projects the next moves.
Elliott Wave Outlook
Wave (A) : Decline from 280 INR to 124 INR (complete).
Wave (B) : Counter-trend rally expected to 162–173 INR ("First Wave C completion zone").
Wave (C) : Final decline projected to 120–128 INR ("Correction Wave C completion zone").
Key Levels
Resistance : 162–173 INR (Wave (B) target).
Support : 120–128 INR (Wave (C) target); 100.74 INR (stop loss on weekly close).
Fibonacci : 162–173 INR aligns with 23.6%–38.2% retracement of Wave (A); 120–128 INR matches 113%–127% extension.
Price Action & Volume
Stock consolidating near 124 INR with smaller candlesticks, indicating indecision.
Volume decreasing, suggesting a potential reversal or continuation.
Trading Strategy
Bullish (Wave (B)):
Buy on confirmation above 128 INR.
Target: 162–173 INR .
Stop Loss: Below 100.74 INR (weekly close).
R:R ≈ 1.63:1 .
Bearish (Wave (C)):
Short below 120 INR.
Target: 100.74 INR .
Stop: Above 128 INR.
Conclusion
TEXRAIL is in a corrective ABC pattern. Expect a Wave (B) rally to 162–173 INR , followed by a Wave (C) decline to 120–128 INR . A weekly close below 100.74 INR turns the outlook bearish. Monitor price action and manage risk.
Disclaimer : For educational purposes only. Trading involves risks; do your own research.
TEXRAIL Chart Insights by @Investofino 🚨 TEXRAIL Chart Insights by @Investofino 🚨
🔍 Key Levels to Watch:
✅ Buy Above: ₹229 (Breakout Confirmation 🚀)
✅ Target: ₹365 (+58.73%)
✅ Stop-Loss: Plan below trendline support for risk management.
📊 Sector: Producer Manufacturing
Mcap: ₹9109 Cr
RVol: 172% (High Interest!)
EPS YoY Growth: +138%
⚡ Analysis:
Triangle breakout indicates potential uptrend.
Volume surge and bullish crossover in RSI/MACD strengthen the setup.
💡 Pro Tip: Wait for sustained movement above ₹229 for entry! 📈
#TEXRAIL #Investofino #StockMarket #Breakout #TechnicalAnalysis


Texrail can give a breakout soon on good resultsTexrail on the verge of breakout keep in your watchlist for long entry.

TEXRAIL S/RSupport and Resistance Levels:
Support Levels: These are price points (green line/shade) where a downward trend may be halted due to a concentration of buying interest. Imagine them as a safety net where buyers step in, preventing further decline.
Resistance Levels: Conversely, resistance levels (red line/shade) are where upward trends might stall due to increased selling interest. They act like a ceiling where sellers come in to push prices down.
Breakouts:
Bullish Breakout: When the price moves above resistance, it often indicates strong buying interest and the potential for a continued uptrend. Traders may view this as a signal to buy or hold.
Bearish Breakout: When the price falls below support, it can signal strong selling interest and the potential for a continued downtrend. Traders might see this as a cue to sell or avoid buying.
20 EMA (Exponential Moving Average):
Above 20 EMA(50 EMA): If the stock price is above the 20 EMA, it suggests a potential uptrend or bullish momentum.
Below 20 EMA: If the stock price is below the 20 EMA, it indicates a potential downtrend or bearish momentum.
Trendline: A trendline is a straight line drawn on a chart to represent the general direction of a data point set.
Uptrend Line: Drawn by connecting the lows in an upward trend. Indicates that the price is moving higher over time. Acts as a support level, where prices tend to bounce upward.
Downtrend Line: Drawn by connecting the highs in a downward trend. Indicates that the price is moving lower over time. It acts as a resistance level, where prices tend to drop.
RSI: RSI readings greater than the 70 level are overbought territory, and RSI readings lower than the 30 level are considered oversold territory.
Combining RSI with Support and Resistance:
Support Level: This is a price level where a stock tends to find buying interest, preventing it from falling further. If RSI is showing an oversold condition (below 30) and the price is near or at a strong support level, it could be a good buy signal.
Resistance Level: This is a price level where a stock tends to find selling interest, preventing it from rising further. If RSI is showing an overbought condition (above 70) and the price is near or at a strong resistance level, it could be a signal to sell or short the asset.
Disclaimer:
I am not a SEBI registered. The information provided here is for learning purposes only and should not be interpreted as financial advice. Consider the broader market context and consult with a qualified financial advisor before making investment decisions.

Texmaco, 15-20% return possible in short term.Best Buying opportunity in Texmaco Share in Short term, Swing Trading
Buying Signal
1. Trend : Positive
2. Level : Straight line & Trend Line Support
3. Candlestick : Pinbar in W pattern
4. Fibonacci 61-50% retracement
5. Treding above 21DMA

Texmaco Rail & Engineering LimitedTexmaco Rail & Engineering Limited, Wait for price to reach demand zone or Break of trend line with momentum to go long.

Technical Analysis of Texmaco Rail & Eng Ltd (Taxrail)Technical Analysis of Texmaco Rail & Eng Ltd (Taxrail)
Comparing TEXMACO RAIL & ENG. LTD. (TEXRA) Across Timeframes
Understanding the Chart: - The provided chart is a technical analysis chart for TEXMACO RAIL & ENG. LTD. (TEXRA) on the National Stock Exchange (NSE) of India. It displays the stock's price movement over a specific period, along with technical indicators like the Exponential Moving Average (EMA) and Relative Strength Index (RSI).
Comparing Across Timeframes: - To get a more comprehensive view of TEXRA's price action, let's analyze the chart in different timeframes:
Hourly (H1) Chart:
Short-term trends: The H1 chart provides the most granular view of price movements. Look for short-term support and resistance levels, as well as potential entry and exit points for day traders.
Momentum: - Pay attention to the RSI's behavior. If it's oversold (below 30), a rebound might be imminent. Conversely, an overbought condition (above 70) could signal a potential pullback.
4-Hourly (H4) Chart:
Intermediate-term trends: The H4 chart offers a middle ground between the H1 and D1 charts. It's useful for identifying intermediate-term trends, potential breakout or breakdown points, and identifying key support and resistance levels.
Daily (D1) Chart:
Long-term trends: The D1 chart provides the broadest view of price action. It's ideal for identifying long-term trends, major support and resistance levels, and potential trend reversals.
Trend strength: Observe the direction of the EMA. If the price is consistently above the EMA, it suggests an uptrend; if it's below, it indicates a downtrend.
Technical Analysis of Texmaco Rail & Eng Ltd (Taxrail)
Overview of the Stock:- The chart presents a technical analysis of Texmaco Rail & Eng Ltd (Taxrail) for the 1-hour timeframe on the National Stock Exchange (NSE) of India. The analysis uses various technical indicators, including moving averages, Fibonacci retracements, and the Relative Strength Index (RSI).
Key Observations
Price Action: - Taxrail has been experiencing a downward trend, with the price currently below its 200-day Exponential Moving Average (EMA).
A "Safe Buy Above 235" level is indicated. This suggests that a potential buying opportunity might arise if the price breaks above 235.
Fibonacci Retracements:
The 0.5 Fibonacci retracement level is at 262.65, which could act as a resistance level.
The 0.618 Fibonacci retracement level is at 254.70, which could also serve as a resistance level.
Relative Strength Index (RSI): - The RSI is currently below 50, indicating that the stock is oversold. This could suggest a potential rebound. However, it's important to monitor the RSI for signs of a reversal.
Potential Scenarios - Based on the current technical analysis, here are some potential scenarios:
Downward Trend Continuation: If the price continues to decline and breaks below the 1.0 Fibonacci retracement level (228.86), it could signal a further downward trend.
Rebound: If the price breaks above the 0.5 Fibonacci retracement level (262.65) and holds above it, it could indicate a potential rebound.
Sideways Movement: The price might remain in a sideways range, consolidating before making a significant move.
Trading Recommendations
Conservative Approach: Traders who prefer a conservative approach might wait for a clear break above the "Safe Buy Above 235" level with strong volume before entering a long position.
Risk Management: It's crucial to implement risk management strategies, such as setting stop-loss orders to limit potential losses.
Remember: Technical analysis is a tool to help identify potential trading opportunities, but it's not a guarantee of future price movements. Always conduct thorough research and consider other factors before making investment decisions.
Disclaimer: - This analysis is based on the provided chart and is for informational purposes only. It does not constitute financial advice. Always consult with a financial advisor before making investment decisions. Do your own research before buying this stock because I am not SEBI registered person and this is just for educational purposes. We are not responsible for your loss.
Thanks for your support as always

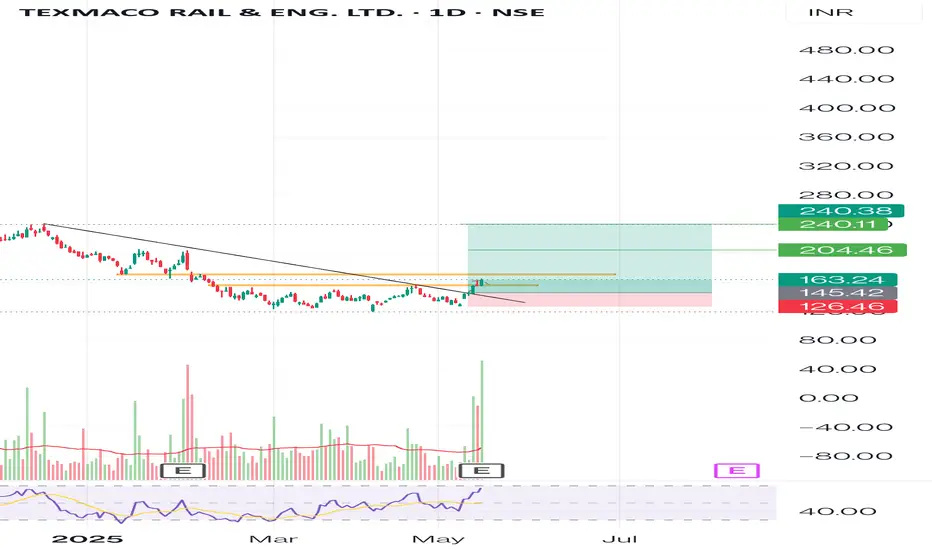
Long oppertunity on TEXRAILTEXRAIL is currently near support level on daily chart. Given that the price broke out at this level with huge volume and appears there is a retest of the support level happening. Its a good time to enter long with stop loss just below breakout candle low. This trade provides ideal risk reward of 1:3. Can wait and see tomm to see if price is supported at this level before entering.
Hope you liked this idea, if so please boost this idea or leave a comment below on what you think. Otherwise, happy trading :-)

Texmaco Rail & Engineering Ltd, target of 430+Texmaco Rail & Engineering Ltd, a part of the Adventz Group, specializes in manufacturing rolling stock, hydro-mechanical equipment, and steel structures, including rail EPC and bridges. Originally part of Texmaco Limited, founded in 1939, the company was established in its current form in 1998 following a demerger in 2010. It has a market cap of ₹9,364 crore and trades at ₹234 per share, with a high P/E of 67.6 and a low ROE of 5.88%. The company has reduced its debt and maintains a healthy dividend payout but faces challenges like a low return on equity and high borrowing costs.

Texmaco Rail & Engineering Ltd, target of 430+Texmaco Rail & Engineering Ltd, a part of the Adventz Group, specializes in manufacturing rolling stock, hydro-mechanical equipment, and steel structures, including rail EPC and bridges. Originally part of Texmaco Limited, founded in 1939, the company was established in its current form in 1998 following a demerger in 2010. It has a market cap of ₹9,364 crore and trades at ₹234 per share, with a high P/E of 67.6 and a low ROE of 5.88%. The company has reduced its debt and maintains a healthy dividend payout but faces challenges like a low return on equity and high borrowing costs.

Necklace Pattern=TEXMACO RAILEntered at 46, already 90% Up.
Is it jumping to reach it's ATH?
This is purely for Educational Purpose, Not a Recommendation or up-selling!

Texmaco rail can make a new high?Looking good
In uptrend
Need volume to pick up
Railway theme!
Can hold until budget
Target300++
Stop 260
Texmaco Rail & Engineering Ltd is an engineering infrastructure co. & part of the Adventz Group, The co. is involved in the business of manufacturing Rolling stock, hydro-mechanical equipment, steel castings & construction of Rail EPC, bridges, and other steel structures
Not a redo.. only for education purpose

Texmaco Rail & Engineering Ltd. Start for Going to upsideTexmaco Rail & Engineering Ltd. Start for Going to upside Seen possible target in upcoming days
224-276- 322-369 minimum Cmp. 204 invalid 138

Texmaco Rail Completed rounding bottom pattern. The next target is 330+
As long as 200 EMA is not breached with good volume it can be on hold.
Since it's moving into newer highs can buy once it consolidates in coming week/month.
Add small quantity 20-30% add more if volume is there in buying.
*Additional govt focus on railway infra
+ Newer proposed spending on Infra should help
Railway sector.

Texmaco Rail Completed rounding bottom on daily timeframe. Texmaco rail has completed rounding bottom pattern now moving towards newer highs .
So the new target is around 330+.

Texrail - Texmaco Rail & Eng Ltd - Buy & HoldHere's a summary of the technical analysis for Texmaco Rail & Engineering Ltd (TEXRAIL) based on various sources:
Overall Trend: - As per previous chart history and technical analysis, overall trend is Mixed for this stock. There's some disagreement between indicators.
Technical rating is currently "buy" on a weekly basis, but oscillators point to a neutral trend overall.
Moving Averages: - Daily moving averages might be showing a bearish crossover, indicating a potential downward trend.
MACD Indicator: - MACD is currently showing a bearish crossover, suggesting a downtrend.
Other Indicators:
RSI (Relative Strength Index) is likely neutral, neither overbought nor oversold.
My Personal Opinion as an Technical Analyst:- On the basis of technical analysis done by me, I suggest to buy and Hold this stock.
Important Dates:
TEXRAIL's next earnings report is on August 8, 2024. This could impact the stock price.
Overall, the technical analysis for TEXRAIL is mixed. Some indicators suggest a downtrend, while others are neutral.
Here are some additional things to consider:
Look at TEXRAIL's stock chart: This will help you visualize the price movement and identify any potential support or resistance levels. All points are mentioned above on the chart.
Do your own research: Technical analysis is just one factor to consider when making investment decisions. You should also consider the company's fundamentals, news, and overall market conditions.
Thanks for your support as always
Disclaimer: I am not a financial advisor and this is not financial advice. Please do your own research before making any investment decisions.
