TITAN trade ideas

TITAN - BREAKOUT ON WEEKLY CHARTSTitan has given a good breakout on the weekly chart. The stock is facing minor resistance at 1695 levels. Buy above 1705 or on dips, with S/L below 1600 for targets of 1800-1850 in coming months.

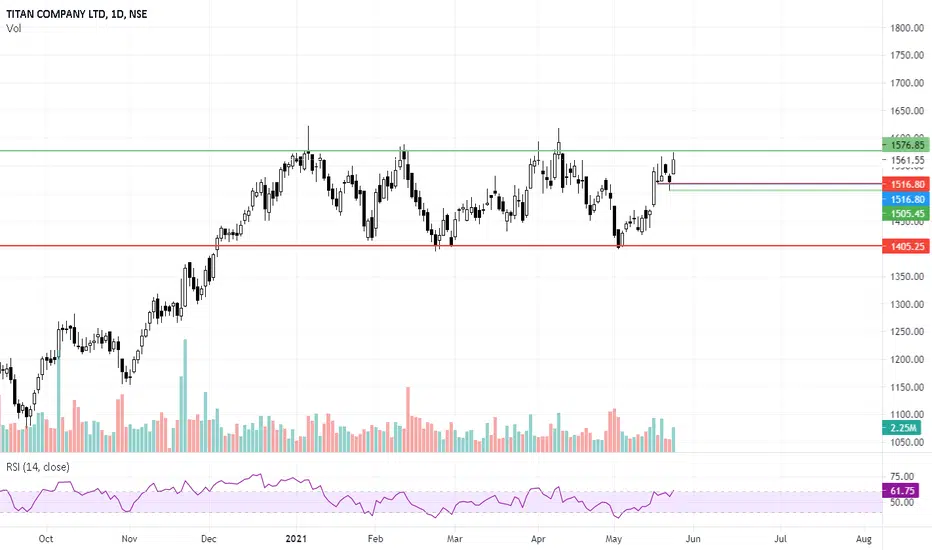
titan breakout time to go longtitan has shown breakout from channel pattern with high volume it is the correct time to go long ,or you can wait for a retracement for best entry


buy bigbulls favorite titan
buy abv- 1600
stoploss -1555
Tgt - 1680-1715-1732+
Disclaimer: The above is shared just for educational purpose and is my personal view.
By no means shall I be accountable for any debits/losses amounting out of it.
I am not a SEBI registered Analyst, so please consult your Investment Advisor and take rational decisions


TITAN -- Possible reversal or cross the reistance? TITAN - testing this level 3rd time.
If cross the resistance .. 1650-1700 in short time possible.
Market at all time high .. any correction here will make TITAN to 1500 and lower levels...
Add to watch list --- trade as per trend.

SHORT TITANTITAN IS SHOWING SIGNS OF REVERSAL IN A CHANNEL PATTERN YOU CAN SHORT WITH A VERY SMALL STOP LOSS WITH HIGH RISK TO REWARD RATIO.


gold and titan goes hand in hand!chances to fire up as inverted head and shoulders along with volume spurt...........


*Titan*Some few points before we going towards the Technical analysis
Covid cases declines Day by day
In june we can see Unlocking series of cities and states if Cases remains low
Vaccination is also started again ,very soon we will have enough Vaccine (Till Dec 2021 - 216cr 2X of our poppulation roughly) So do not panic for that,
Now comes towards Technical points
Titan breach very strong trendline came from Bottom of Covid
We can add small qty here and add more again at All time high breakout of level 1625
Note - Before taking any entry exit please concern with your financial advisor

Buy titan abv 1590Buy titan abv 1590 . trgt Buy titan abv 1600 -1630-1661-1682
stop loss 1541.
Disclaimer: The above is shared just for educational purpose and is my personal view.
By no means shall I be accountable for any debits/losses amounting out of it.
I am not a SEBI registered Analyst, so please consult your Investment Advisor and take rational decisions

Keep Titan on Radar for Breakout TradeTitan is one such stock that has been trading in a range of about 15% for the past 5 months.
The Recent rally from range support ( the move I already captured - please refer to linked post ) looks quite good and the stock currently is trading at the range upper end, any breakout might bring a fresh buying in the stock and it can move
towards 1700 and 1750 levels.
Breakout at TitanBuy Titan after clear visibility of breakout along with volume then there will be multi conformational Buy.
1) Breakout in 1h chart
2) Cup with handle pattern
3) FIbo level 23.6%
4) High volume
Hold stock for short term for T1 & T2, SL will be shared if stock moves in opposite direction after buying.

buy titanbullish shark harmonic pattern has formed in titan. it can retrace till 0.38%-0.50% of point CD

Titan - Trendline Breakout TradeTrendline trading is the easiest form of trading, all you need to do is to learn the art of drawing trendlines.
In this post, I will tell you, how I identify trendline breakout trades
The first step is to identify the structure of the stock, which is necessary for identifying the current trend in the underlying stock.
Once you have identified the trend, start drawing the trendline in the direction of the trend for ex. in a downtrend structure, draw a trendline connecting high points and in an uptrend, draw a trendline connecting low points.
For Conforming trendline validity, make sure that it has a minimum of 3 points of supports or resistance as the case may be.
Then sit tight and wait for the trendline breakout with good volume and good momentum, and voila you have identified a breakout/Breakdown trade.
One more thing I do is to keep, higher time frame trend in consideration to find high probability trades.
Now, this an example of titan, where the structure of the stock on hourly is of lower lows and lower highs, so I drew trendline connecting highs and you can see the trendline had 4 resistance points, making it valid for breakout trades, plus as I said i keep higher time frame direction in consideration, which was bullish on the daily chart, hence this breakout trade is a high probability trade because it is in the direction of the daily chart.
I could also see so many parameters that are loading in favour of the trade, but it will only add confusion if I explain it here, hence keeping it simple, for now, will discuss that in other trades examples...

