TORRENT POWEREnter above 353 with same as the sl for the target of 369, it near 52 week high which is 347, can be entered at this level too, but then sl would be a bit deep.
TORNTPOWER trade ideas


TORRENT POWER /BEARISH TARGET (321/314)RSI: showing divergence (showing bearishness)
also price is trading near 21 EMA, filling up gap (price & EMA). IF price closes below EMA 21 and also closes below trend line..stock will break


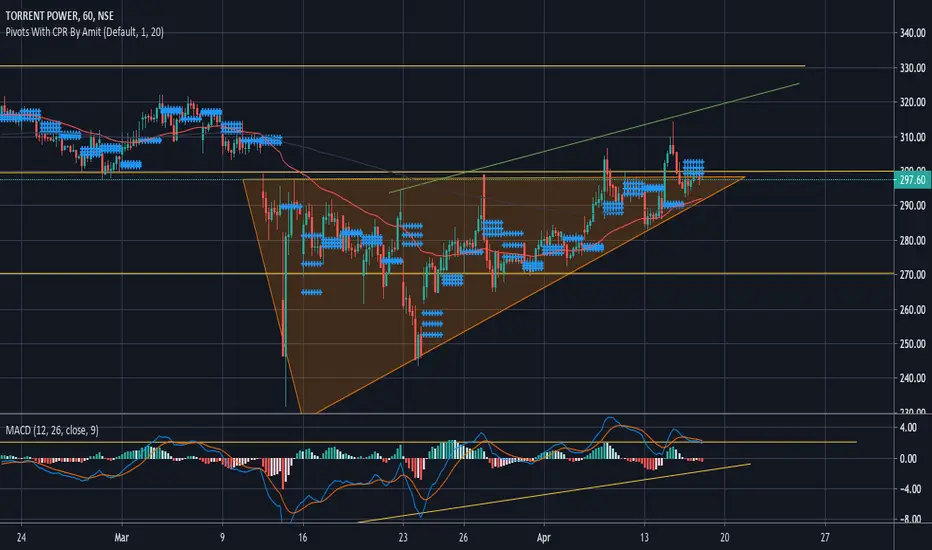
Torrent Power (Range Bound or Ready for a Breakout ?)Torrent Power has been trending higher recently following the general market trend. After forming a low at 230-240 levels it is again at its 2 month peak zone. The yellow lines are formed based on Daily time frame and the green line is for the Hourly time frame. The lines showcase the area of Support or Resistance.
It gave a breakout twice from the Triangle formation only to retrace back, However to support the bullish sense the price has been making Higher highs and Higher Lows. It stands at a juncture where it might make or break the ongoing trend.
After a Quiet day today the CPR is meant to contract for the following day i.e Friday and same will be the case with Indices, So a certain trending day can be expected. And if that would be the case we can expect Torrent Power to give strong moves. An Open above tomorrows CPR would be a supporting signal for the Bulls.
However the MACD has just broken towards the downside of its trend line which might a thing to watch in trade tomorrow.
Taking the recent volatility into consideration and the wild moves that Torrent Power has given which side will you be looking to bet on tomorrow ?
TorntPower Long (Preliminary Analysis)Based on Market sentiment there is a long bias being observed in the stock. Daily key levels are marked with the blue breach of which can initiate a fresh trend. While the yellow zones are respectively the immediate demand and supply zones. Constricted CPR suggests a strong trend in the following trading session. Lastly, the volume squeeze seem ready to be enthralled to support the momentum built up.

TORNTPOWER - GO SHORT FOR A RR OF 1:7TORNTPOWER - GO SHORT @ 335 WITH A SL OF 350 AND A TARGET OF 235 BY JULY 2020

Technical Analysis Class-Rounding Bottom Chart Pattern BreakdownDaily Chart Observations
Point no.1-Resistance–
1) Previous swing high resistance.
2) Trend line resistance.
Point no.2-Support-previous swing low support. Now the price has broken the support area.
Point no.3-Rounding Bottom Pattern– Bearish Pattern
Point no.4- Double top Chart Pattern – Two tops at the resistance area.
Point no.5-Breakdown–
1) Price breaks the double top pattern
2) Price breaks the rounding bottom Pattern
Conclusion
From the above chart, it is clearly seen that there is a structural breakdown and price is trading below the important pattern. So there is a high probability of a further down move
Learn and Improve Technical Analysis
Visit marketsolutions.in
Disclaimer- This post is for educational purposes only, our view is, to teach technical analysis only. we are not recommended to use this analysis for the purpose of trading. once again this is an educational forum only.

SHORT TORRENT POWERSHORT TORRENT POWER
CONDITIONS
1. PRICE SHOULD BREAK 294
2. THEN PRICE SHOULD GO NEAR TO 300
SHORT AT 300-305 (OBSERVE 1HR CANDLE)
FIRST TARGET 277 ... SECOND TARGET 266
STOP LOSS 313.25
USE TRAILING STOP LOSS THEREAFTER
ONE TO TWO WEEKS TRADE. THESE ARE SPOT PRICES.
ALL THE BEST
NOTE: ABOVE TRADE IS FOR EDUCATIONAL PURPOSE. PLEASE CONSULT YOUR ADVISOR.

Trade 15 BV SETUP: Short below 257.5(1h cls) SL260.4.T1-255.2BV Setup
This only for Educational purpose.

TORNTPOW ready for next swing?Bounces off a weekly support and price closed at the top in daily. Took a long position with stop and targets as shown.

A fundamentally backed solid compoUnder-TORRENT POWERNSE:TORNTPOWER BSE:TORNTPOWER While this is a expanding ascending wedge, but i have a conviction this will not breakdown rather breakout..
1. excellent management team with good earnings n growth and diversified power generation with distribution, but i would rather not discuss the fundamentals here..
2.the ML of pitchfork has not been broken for the past 2 years and i dont find any reason why it wouldnt give support now..
3. the bounce is expectd to halt at the 618line of the schiff pitchfork which lines up with a lot of pivot resistance and fibo levels..
Still, it would be an safer choice t monitor whats happening with the lower support trend line
Discalimer... Invested and trading active... Not an investing/trading recommendation..

buy torntpowr at current price...btwn 283-288buy with strict stop loss and trgt mentioned on chart.....cunsult your expert bfore takin any trading decidion...i am not a sebi registered analyst


Target 300Torntpower is in a uptrend and has formed a perfect Cup and Handle pattern now. Target should around 300-310 in next 6 months max.

Torrent Pharma Break outIt is a breakout for a short term to a target of 210 and if the breaks out then it will test 250
