TRENT: TR-ENDMcap Rs 220,000 cr
Growth: What Growth !!
EPS peaked in March 24, ( 5 quarters back)
PER 150 ( on latest ann EPS)
Only 3 out of 24 analysts on the Dalal Street are Bearish, more would realise the mistake very soon.
TRENT trade ideas

Review and plan for 1st July 2025Nifty future and banknifty future analysis and intraday plan.
swing idea - trent
This video is for information/education purpose only. you are 100% responsible for any actions you take by reading/viewing this post.
please consult your financial advisor before taking any action.
----Vinaykumar hiremath, CMT

Trent showing BreakoutNSE:TRENT showing breakout with Ascending Traingle. You can enter at the current Point . 1st target would be 6130, Second Target would be 6260. Keep the Stoploss at 5650. One who is trying for Second target , try to achieve the same by Trailing stoploss.
Note : Considering the Ongoing Isreal - Iran - US Tensions, the Markets would be fluctuating and if you can buy at 5800 it would be great!

Trent on a bull mode?Broken 100ema and retested on 10ema and bounced with a big candle..
missed bottom pick..seems little more steam left.
6500 Target1..7k Target2
exit below 5900.
Slowly going up so need patience to hold..
part of tata group.
Trent Ltd is engaged in retailing of apparels, footwear, accessories, toys, games, food, grocery & non food products through various of its retail formats/ concepts.


Ye Chart Kuch Kehta Hai : Trent LtdTrent India Limited is attractive for mid to long-term investment because it combines strong financial performance, aggressive growth plans (especially through Zudio), a diversified retail portfolio, and solid backing from the Tata Group. The company is positioned well to capitalize on the growing Indian retail market, with positive analyst outlooks and significant upside potential in share price. Risks include competition in grocery formats and valuation sensitivity, but overall, Trent offers a compelling growth story with robust fundamentals for investors looking at a 3-5 year horizon or longer
Trent India Limited is considered a lucrative stock for mid-term to long-term investment due to several strong fundamentals and growth prospects:
1. Robust Revenue and Profit Growth
Trent has demonstrated impressive financial performance with annual revenue surging by about 82% in the last year and quarterly revenue growing 50% year-over-year, significantly outperforming sector averages.
Quarterly net profit rose by over 124% year-over-year, indicating strong profitability and operational efficiency.
The company maintains a healthy Return on Equity (ROE) of around 29-31% and Return on Capital Employed (ROCE) of about 21-42%, reflecting effective capital utilization.
2. Strong Growth Prospects and Expansion Plans
Trent aims for a 25%+ annual growth rate over the long term, supported by aggressive store expansion, especially through its fast-fashion brand Zudio, which is rapidly increasing its footprint with over 750 stores and plans to add more.
The fashion and lifestyle segment in India is expected to grow at 10-12% CAGR to ₹18 trillion by 2028, providing a large market opportunity for Trent.
Trent’s diversified retail portfolio, including Westside (semi-premium fashion), Zudio (value fast fashion), and Star Bazaar (grocery), reduces dependence on any single segment and broadens consumer reach.
3. Strong Backing and Brand Value from Tata Group
Being part of the Tata Group, Trent benefits from strong corporate governance, brand reputation, and strategic retail synergies, which enhance investor confidence and operational strength.
4. Positive Analyst Ratings and Target Price Upside
Leading brokerages like Motilal Oswal, Goldman Sachs, HSBC, and Macquarie have given buy or outperform ratings on Trent, with target prices suggesting 16-45% upside from current levels, reflecting strong market confidence in its growth trajectory.
HSBC values Trent’s standalone business at a premium P/E multiple, justified by its higher growth, profitability, and return profile compared to peers.
5. Financial Strength and Low Debt
Trent is virtually debt-free, which lowers financial risk and provides flexibility for expansion and investment.
The company has shown consistent margin improvements and strong EBITDA growth, with a 37% year-on-year jump in EBITDA recently, indicating operational efficiency.

Trent Ltd: Breakout or Fakeout?Trent Ltd: Breakout or Fakeout? Someone’s positioning — the question is which side.
Trent Ltd remains one of the more resilient players in India’s retail landscape. While broader consumer sentiment remains mixed, the company continues expanding its footprint, especially through its Westside stores and fashion vertical. Recent earnings have been stable, and institutional interest appears to be creeping back in — confirmed by a steady rise in volume.
Technically, we’re at a decision point. Price is testing a major descending trendline drawn from the all-time highs. So far, no breakout — but signs of accumulation are building. All major EMAs (50/100/200) are below the price, putting buyers firmly in control. Volume is rising on bullish candles, with no signs of distribution. RSI is holding above 50, climbing steadily, and showing a healthy impulse without overheating — plenty of room left for upside.
The key setup: wait for a confirmed breakout above the trendline, then a retest, and only after that consider entering. Targets, based on Fibonacci levels, line up cleanly:
tp1: 6337.60 (0.618)
tp2: 7484.65 (1.0)
tp3: 8301.40 (1.272)
Until then — this is a watching game, not a trading one. Momentum is building, the structure is clean — but confirmation is king.

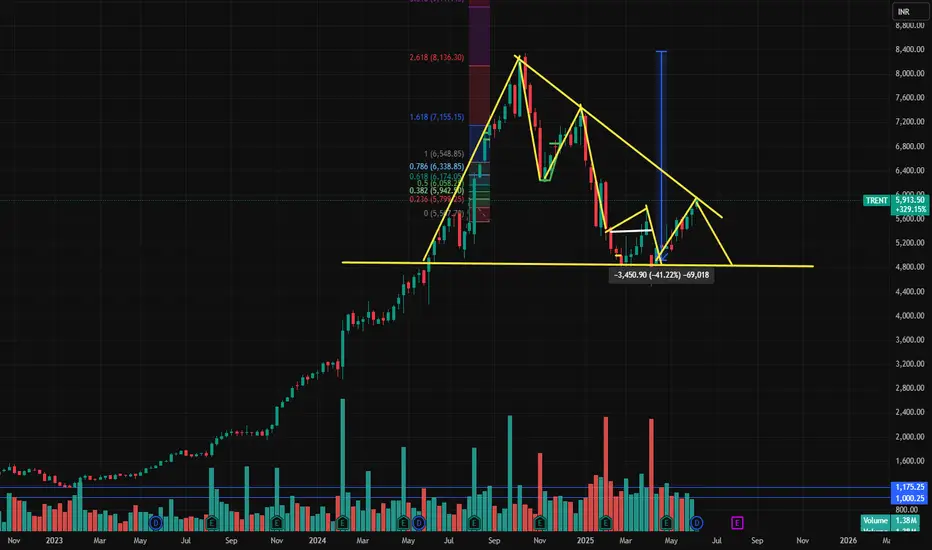
TRENT Weekly Chart-After a massive 41% correction, the stock is showing signs of reversal with a strong W-pattern and falling wedge breakout attempt.
Watch ₹6,000 closely — a breakout above could trigger fresh momentum toward ₹6,500 and beyond.
₹4,800 remains a critical support to protect.
Volume buildup will be key for confirmation.
⚠️ Not a recommendation. Do your own research.
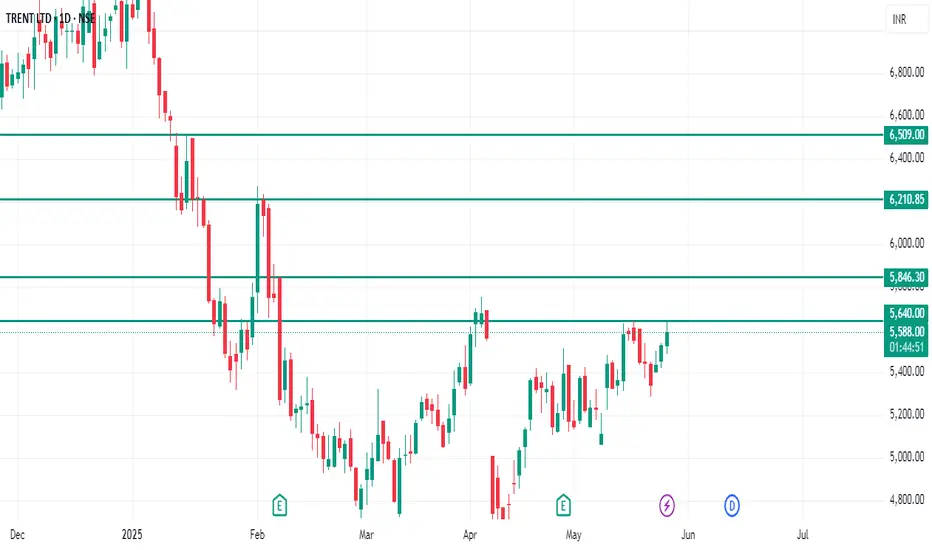
Go long in TRENT Go long in TRENT only if it's manage to close above 5640 on daily frame. On the upside, we can expect targets of 5845, 6210 & 6500.
TRENT - Trent LTD (2 hours chart, NSE) - Long PositionTRENT - Trent LTD (2 hours chart, NSE) - Long Position; short-term research idea.
Risk assessment: Medium {volatility risk}
Risk/Reward ratio ~ 2
Current Market Price (CMP) ~ 5140
Entry limit ~ 5080 to 4940 (Avg. - 5010) on April 25, 2025
1. Target limit ~ 5145 (+2.69%; +135 points)
2. Target limit ~ 5280 (+5.39%; +270 points)
Stop order limit ~ 4875 (-2.69%; -135 points)
Disclaimer: Investments in securities markets are subject to market risks. All information presented in this group is strictly for reference and personal study purposes only and is not a recommendation and/or a solicitation to act upon under any interpretation of the letter.
LEGEND:
{curly brackets} = observation notes
= important updates
(parentheses) = information details
~ tilde/approximation = variable value
-hyphen = fixed value

NSE: TRENT Bullish Reversal Start DTF/WTF TGT 7500 in 160days Stock Analysis
Trade Plan:
Entry: 25% of the total quantity at 5580 DTF Close, with an additional 50% added at 6200 DTF Close Price.
Stop Loss: 5100
Target 1: 7500
Target 2: 8200
Hold for a period of 6 months to 1 year or until the target 2 is reached.
Chart Pattern:
The stock experienced a 24-month streak to touch an all-time high (ATH) of 8300 . Subsequently, it retraced in 4730 in 6M time.
Technical Indicators:
The stock’s daily timeframe (DTF) shows that the price is currently trading above the 50-day exponential moving average (EMA) and the 20-day EMA below the 50D EMA. This indicates a transitional phase of alignment in the stock’s EMA indicators. A potential bullish trend in formation on the DTF/WTF timeframe.
This current level could serve as a potential entry point for investors, depending on their risk tolerance. More cautious investors might consider entering above the retracement level.
Volume Analysis:
There has been a drying up of volumes on the sell side for a two quarter now. There is buying in the past four weeks but above the 20VMA.
Prioritize Watch List:
Keep this stock in your watch list for further analysis and potential trading opportunities.
Disclaimer: This information is solely for educational and reference purposes. Trading inherently carries risks, and it’s crucial to exercise caution and conduct comprehensive research before making any investment decisions. Make sure you have a well-defined risk appetite, proper position sizing, and a stop-loss order based on your risk tolerance. Review your Portfolio periodically. Exit positions when the price closes 7-8% below your entry point or When 9EMA crosses Below 21EMA in DTF. Earlier too basis your Risk profile. Consider re-entering the market when the trend reverses.Before engaging in any trading activities, it is paramount to thoroughly comprehend these technical analysis concepts and conduct extensive research on the stocks you are interested in. Furthermore, consulting a certified financial advisor can offer valuable insights and guidance before making investment decisions.
Technical Analysis Concepts:
Multiple Time Frame Analysis (MTFA):
Daily Time Frame (DTF): Used for short-term analysis and identifying trends.
Weekly Time Frame (WTF): Provides a broader perspective and helps in trend confirmation.
Monthly Time Frame (MTF): Ideal for long-term analysis and trend analysis.
All-Time High (ATH): The highest price reached on a specific chart.
Lifetime High (LTH): The highest price reached over the entire chart’s history.
Stop Loss (SL): A predetermined price level at which an investment is automatically exited to limit potential losses.
Swing Trade: A trading strategy that involves holding positions for a significant period, typically few weeks to months.
Positional Trade: A trading strategy that aims to capitalize on long-term trends and position oneself accordingly.
CHART PATTERNS
Rounding Bottom Cup/Handle (RBC&H): A pattern that signals a potential reversal from a downtrend.
Breakout (BO): A price move closure above a resistance or below a support level.
Flag & Pole BO: (F&P BO) Bullish Continuation Pattern
Consolidation : Price Typically Swings between a Range for a period of Time Long or Short basis the MTFA. Breaking out of this range UPWARDS is an opportunity to BUY and DOWNWARDS is SELL opportunity.
Moving Averages:
Exponential Moving Average (EMA): A popular moving average that places more weight on recent price data.
Volume-Weighted Moving Average (VWMA): A moving average that gives more weight to high-volume stocks.
Fibonacci Retracement/Extension:
Trend-based Fibonacci Retracement: Used to identify potential support and resistance levels during re-tracements.
Trend-based Fibonacci Extension: Used to identify potential breakout levels during extensions.


TRENT ON TREND - CLOSING ABOVE 5290Everything is pretty much explained in the picture itself.
I am Abhishek Srivastava | SEBI-Certified Research and Equity Derivative Analyst from Delhi with 4+ years of experience.
I focus on simplifying equity markets through technical analysis. On Trading View, I share easy-to-understand insights to help traders and investors make better decisions.
Kindly check my older shared stock results on my profile to make a firm decision to invest in this.
Kindly dm for further assistance it is for free just for this stock.
Thank you and invest wisely.


TRENTTRENT, find the chart and Redline is our stoploss.
DISCLAIMER : I am NOT a SEBI registered advisor or a financial adviser. All the views are for educational purpose only.

Short The current market price of the stock at 5,490, is significantly inflated compared to its estimated intrinsic value of approximately 1,555, based on the current EPS of 14.43 and the P/E ratio of 107.84. This stark discrepancy suggests that the stock is trading well above its fundamental worth, implying that it may be overvalued.
Such a valuation could be driven by overly optimistic market sentiment or speculative buying, especially given that we are in an environment where market prices have reached unprecedented levels not seen in recent history. If the market corrects, as many analysts anticipate, the stock price could face a significant downward adjustment, leading to what some are predicting could be a bloodbath in the near future.
This scenario highlights the disconnect between the stock’s price and its true intrinsic value, suggesting that the market may be overpricing future growth prospects, or investors are too focused on short-term factors rather than the company’s actual earnings performance and financial health.
Sell on trentVolume Profile indicators are calculated using the data for the same symbol from the lower timeframes. For example, to calculate the Volume Profile for one daily session, we load all 1m bars that were traded in that daily session, analyze the price levels where they were traded and the direction that the price moved in – if the bar closes above or equal to its open, this counts as an Up bar, otherwise it's a Down bar. Once analyzed, this data is added to the Volume Profile histogram.
The particular logic used to decide which lower timeframe should be used for the calculation differs on an indicator-by-indicator basis.
Volume uses in the calculations
Volume Profile uses the following types of volume:
trade volume - for stocks.
tick volume* - for indices/forex and crypto cfd
base or quote volume - for crypto
* tick volume indicates the amount of price updates.We use up/down volume instead of buy/sell volume and calculate VP based on a price direction inside bars: if close >= open, we take it as an Up Volume, if close < open, it's Down Volume.

Review and plan for 16th January 2025Nifty future and banknifty future analysis and intraday plan.
Stock ideas included.
This video is for information/education purpose only. you are 100% responsible for any actions you take by reading/viewing this post.
please consult your financial advisor before taking any action.
----Vinaykumar hiremath, CMT

Review and plan for 3rd January 2024 Nifty future and banknifty future analysis and intraday plan.
Swing idea in stock.
This video is for information/education purpose only. you are 100% responsible for any actions you take by reading/viewing this post.
please consult your financial advisor before taking any action.
----Vinaykumar hiremath, CMT

Trent Price are making HHHL
Seem like stock have bottom out
[Price are above 50 and 200 DSMA
Important support -6245 ( price have shown some good reversal from strong support area )
Support -6000/6800
Resistance - 7500-7900
Target -8500/9000
Time frame -6-12 months


DO NOT MISS 20 % RALLY IN FAST FASHION MASTER - TRENT LTDEverything is pretty much explained in the picture itself.
I am Abhishek Srivastava | SEBI-Certified Research and Equity Derivative Analyst from Delhi with 4+ years of experience.
I focus on simplifying equity markets through technical analysis. On Trading View, I share easy-to-understand insights to help traders and investors make better decisions.
Kindly check my older shared stock results on my profile to make a firm decision to invest in this.
For any query kindly dm.
Thank you and invest wisely.

Start of the impulse wave | DB breakouthello fellow traders,
Trent has taken support on ascending trendline and impulse wave of the bull swing at weekly time frame has started.
The the DB neckline breakout at daily time frame was the trend change confirmation.
The target 1 is 22% and target 2 is 42% from CMP respectively
Risk reward ratio for the target 1 is 1:2.37 and target 2 is 1:4.75
The FNO strategy is below:
Set the target values as shown in the chart to get the projected profits at the below link.
sbull.co
