TVSMOTORTVS Motor perfectly retraced at daily chart but getting resistance on hourly chart on RSI, If RSI trendline broken then 516 can be seen in coming days
TVSMOTOR trade ideas


INTRADAY STOCKS SELECTIONS ( 10/9/2020)
A breakout is a potential trading opportunity that occurs when an asset's price moves above a resistance level or moves below a support level on increasing volume.
The first step in trading breakouts is to identify current price trend patterns along with support and resistance levels in order to plan possible entry and exit points.
Once you've acted on a breakout strategy, know when to cut your losses and re-assess the situation if the breakout sputters.
As with any technical trading strategy, don't let emotions get the better of you. Stick with your plan and know when to get in and get out.

TVSMOTOR in buy Zone at POCTVSMotor has reached to our buy zone with its location at Point of Control Level We are confident that the stock would perform better in days to sideways movement. Why? This POC level was crossed once and the price has come back to say hello to it. I like when the price chit chats with support and resistance making it more promising move.

Stock: TvsMotorsStock: TVSMOTOR
#MorningStar
#DownwardPriceChannel
#SymmetricalTriangleInMaking
#AnticipatedMajorTrendlineBreakout
Looking Good Above 482 for Long

Expected TVS may fall on MondayExpected TVS may fall on monday if Nifty is negative... Short sell it ..


TVS MOTORS CRUCIAL POINT TO WATCH OUT FOR TOMORROW RISING WEDGE PATTERN
A BREAKDOWN WILL GIVE A FALL OF 15 TO 20 POINTS.
GOOD BUYING OPPORTUNITY WILL BE WHEN IT TAKE SUPPORT ON 200 DMA.


R-0156 TVS MOTOR CHANGES IT GEAR (LONG)About to break ichimoku cloud on the upside
TK cross over + MACD cross over
BUY 420
TGT 439
SL 409


TVSMOTORS
CHECK THE ABOVE CHART, CLEARLY HAD INDICATED 410 LEVELS AS RESISTANCE AND LEVELS TO WATCH
FINALLY IT HAS CROSSED THE SAME IS READY TO BOUNCE TO 433 AND 446.50
TRAIL THE STOP LOSS
******************************************************************************************************************************************************************
Hi all,
Its pleasure to have you all here.
I have started putting these charts as a contribution from my side to all people who are new to business, as I had to struggle a lot without any sources at disposal. So please consider this a just small contribution from my side.
Few Honest Disclosures:
1. Any idea shared is my personal view, its not a recommendation, neither any kind of paid propaganda, so please
do your bit of research.
2. Ideas shared does not mean that I trade all or have position in them, this is just a helping hand to all.
3. I expect no comments or like nor any negativity, as I said its just a small helping hand from my side, please plan your risk and trade as per your capacity.
4. To trade in Cash, options or futures is your sole choice and your own risk
5. I am no expert in Tech Indicators, I believe in support resistance and trendline theory, you may use this as a supplement theory for better results.
6. I work for my own living, this is a hobby which I do sincerely to help anyone who might come across my charts.
***********************************************************************************************************************************************


TVS motorsHello!! TVS motors one of the famous brands for motorcycles in India. It is also giving a buy signal but still if it breaks the trendline and the support then lower lvls can be seen. #my_view #learner

TVS - GO LONG FOR JULY EXPIRYTVS - GO LONG @ CMP WITH SL OF 389.95 AND A TARGET OF 437. TARGET SHOULD BE ACHIEVED BY THIS EXPIRY

TVSMOTORSNSE:TVSMOTOR
TVSMOTORS - bearish position seems to be building
Keep an eye and trade as per levels.
**********************************************************************************************************************************************
Hi all,
Its pleasure to have you all here.
I have started putting these charts as a contribution from my side to all people who are new to business, as I had to struggle a lot without any sources at disposal. So please consider this a just small contribution from my side.
Few Honest Disclosures:
1. Any idea shared is my personal view, its not a recommendation, neither any kind of paid propaganda, so please
do your bit of research.
2. Ideas shared does not mean that I trade all or have position in them, this is just a helping hand to all.
3. I expect no comments or like nor any negativity, as I said its just a small helping hand from my side, please plan your risk and trade as per your capacity.
4. To trade in Cash, options or futures is your sole choice and your own risk
5. I am no expert in Tech Indicators, I believe in support resistance and trendline theory, you may use this as a supplement theory for better results.
6. I work for my own living, this is a hobby which I do sincerely to help anyone who might come across my charts.
***********************************************************************************************************************************************


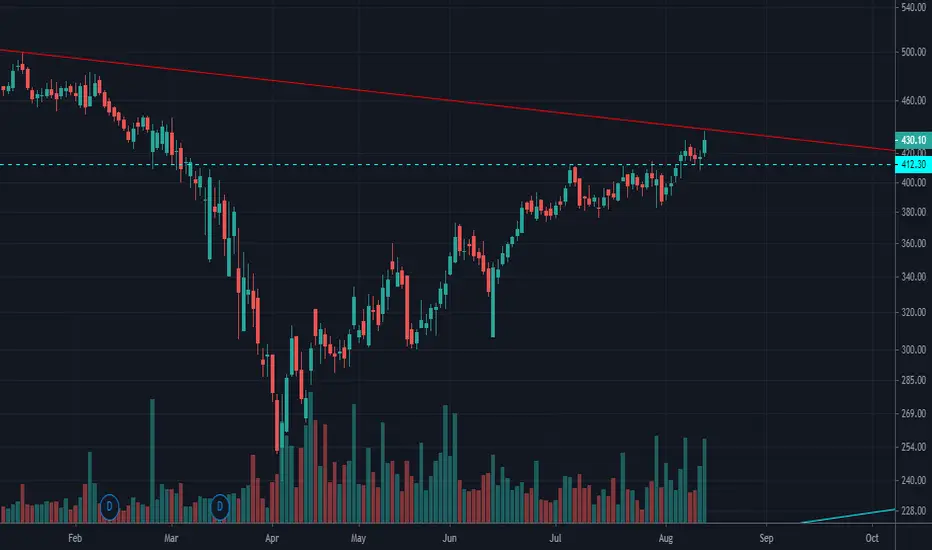
2 year downtrend line 12% awayQuick All time graph for this since 2 wheeler demand is set to soar and this is lagging from the other bike segment shares thought why not check it out..
Would be interested in intra day for this as it is nearing the breakout from its long term downtrend line.
Maybe get a swing till 499 which is a decent trade from current 387.95 .
time frame most likely a few months hence more interested in catching the meat of the move closer to breakout .
Assuming one rejection at the very least from the downtrend line so let reassess from there with the Nifty should have breached 10750 by then or not :)

Last Opportunity to BUY TVS MOTOR Hello, guys welcome Back My self Ravindra,
Guys please if you like my analysis then like it takes hours for making No more words Please.
When you analyze Through elliote wave, Wave 3 is done at 340 Level which is approx 0.382 Fib level Its confirm. Now According to Elliote Wave after wave 5 we see a major fall Around 260 Points from 1 FEB to 8 APRIL.
According to technical analysis, we have done our 5 th elliote wave at 240 levels ( Making Round Bottom )
, Now price is riding on a corrective wave A, B, and C, Stock Might Move toward 400-450-500 After Retracing Wave B @360-340 level Then further we will move toward wave C Which Is our Target and Volume is Increases continuously.
Thanks


