Ujjivan SFB | Cup & Handle Breakout Setup Brewing – Watch✅ Pattern Recognition & Price Structure:
Cup and Handle Formation:
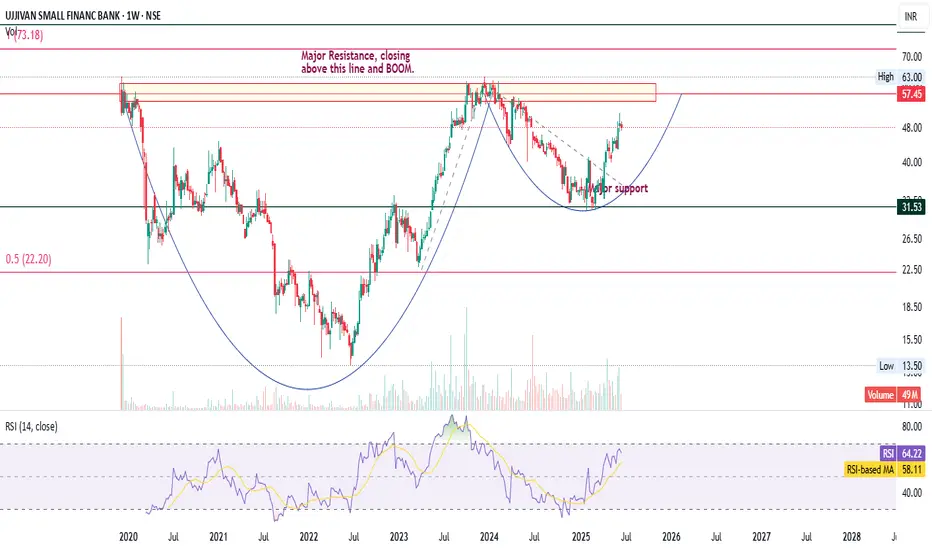
Two distinct cup-like bases are forming a larger “Double Cup & Handle” structure — a strong bullish continuation pattern.
First cup (2020–2023): Already completed with breakout above mid-point neckline.
Second cup (2023–2025): Currently approaching breakout zone.
📌 Key Levels:
Major Resistance Zone: ₹57.45 – ₹63.00
Labeled as “Major Resistance, closing above this line and BOOM” — breakout above this level may trigger a strong upward momentum.
Support Levels:
₹48.00: Current price zone acting as intermediate support.
₹31.53: Previous base — strong historical support.
₹22.20: 50% retracement level of a prior swing (Fibonacci).
🔍 Volume Analysis:
Noticeable volume pickup during recent rally — suggests accumulation and bullish interest.
Current volume: 49M
📈 RSI (Relative Strength Index):
RSI (14): 64.22 → Bullish Momentum, not yet overbought.
RSI is above RSI-based MA (58.11), confirming positive momentum and trend continuation.
📝 Summary & Outlook:
Structure suggests a long-term bullish setup with high potential if the ₹57.45–₹63.00 zone is breached.
RSI supports bullish strength; volume supports accumulation.
Closing above ₹63 could confirm the breakout from the larger cup & handle pattern — a BOOM scenario as marked.
⚠️ Caution/Watchpoints:
Resistance zone around ₹57.45–₹63 is critical — repeated rejection here can cause short-term pullbacks.
Watch RSI for any divergence near breakout zone.
UJJIVANSFB trade ideas
Head and shoulder pattern seen in Ujivan-sfbneckline at rs 60 in ujjivan sfb
After breakout
Target becomes 95-102
So add the alert at 60 rs
View is long term , for atleast 3 years
Ujjivan Small Fin BankEducation Purpose Study
As of February 28, 2025, Ujjivan Small Finance Bank Limited's stock (NSE: UJJIVANSFB) was trading at ₹32.13.
Analyst forecasts suggest a potential upside for the stock, with an average 1-year price target of ₹44.71, ranging between ₹36.00 and ₹59.00.
Another analysis estimates an average target of ₹46.13, indicating a possible 46.68% increase from the current price.
Financially, the bank has demonstrated strong performance, with a 5-year compounded annual profit growth rate (CAGR) of 45.0%.
Additionally, it offers a dividend yield of 4.67%.
However, it's important to note that some forecasts predict a potential decline in the stock's value. One analysis projects a decrease from ₹31.74 to ₹15.32, a drop of approximately 51.73%.
Another source indicates that the stock is currently oversold, with a 90% probability of trading between ₹31.91 and ₹40.53 in the near term.
For Paper trading you can Put it in your watchlist.

ujjivan small fin bankhas submitted the formal application to the Reserve Bank of India for a Universal Banking License,


Ujjivan Small Finance Bank
The stock has been in a downtrend but appears to be in a consolidation phase. The key levels to watch are the support at 35 INR and resistance at 45 INR. If the stock breaks above 45 INR with significant volume, it could signal a potential reversal or at least a move towards higher resistance levels. Conversely, a break below 35 INR might lead to further declines.
Investors should look for confirmation of a breakout from this range, along with volume changes and any fundamental news related to Ujjivan Small Finance Bank that could influence stock movement and it will Test again 45 levels

UJJIVANSFBHi guys,
In this chart i Found a Demand Zone in UJJIVANSFB CHART for Positional entry,
Observed these Levels based on price action and Demand & Supply.
*Don't Take any trades based on this Picture.
... because this chart is for educational purpose only not for Buy or Sell Recommendation..
Thank you

Ujjivan SFB oversold# Showing strength from Weekly oversold zone
# Negatives mostly discounted
# No to very limited downside.

UJJIVAN SFB S/RSupport and Resistance Levels:
Support Levels: These are price points (green line/shade) where a downward trend may be halted due to a concentration of buying interest. Imagine them as a safety net where buyers step in, preventing further decline.
Resistance Levels: Conversely, resistance levels (red line/shade) are where upward trends might stall due to increased selling interest. They act like a ceiling where sellers come in to push prices down.
Breakouts:
Bullish Breakout: When the price moves above resistance, it often indicates strong buying interest and the potential for a continued uptrend. Traders may view this as a signal to buy or hold.
Bearish Breakout: When the price falls below support, it can signal strong selling interest and the potential for a continued downtrend. Traders might see this as a cue to sell or avoid buying.
20 EMA (Exponential Moving Average):
Above 20 EMA: If the stock price is above the 20 EMA, it suggests a potential uptrend or bullish momentum.
Below 20 EMA: If the stock price is below the 20 EMA, it indicates a potential downtrend or bearish momentum.
Trendline: A trendline is a straight line drawn on a chart to represent the general direction of a data point set.
Uptrend Line: Drawn by connecting the lows in an upward trend. Indicates that the price is moving higher over time. Acts as a support level, where prices tend to bounce upward.
Downtrend Line: Drawn by connecting the highs in a downward trend. Indicates that the price is moving lower over time. It acts as a resistance level, where prices tend to drop.
RSI: RSI readings greater than the 70 level are overbought territory, and RSI readings lower than the 30 level are considered oversold territory.
Combining RSI with Support and Resistance:
Support Level: This is a price level where a stock tends to find buying interest, preventing it from falling further. If RSI is showing an oversold condition (below 30) and the price is near or at a strong support level, it could be a good buy signal.
Resistance Level: This is a price level where a stock tends to find selling interest, preventing it from rising further. If RSI is showing an overbought condition (above 70) and the price is near or at a strong resistance level, it could be a signal to sell or short the asset.
Disclaimer:
I am not a SEBI registered. The information provided here is for learning purposes only and should not be interpreted as financial advice. Consider the broader market context and consult with a qualified financial advisor before making investment decisions.

Technical Analysis of Ujjivan Small Financ Bank (UJJIVANSFB)Technical Analysis of UJJIVANSFB
Overview of the Stock - The provided chart shows a 1-hour timeframe chart of UJJIVAN SMALL FINANC BANK (UJJIVANSFB) on the National Stock Exchange (NSE) of India. The chart includes price action, indicators like EMA (Exponential Moving Average) and RSI (Relative Strength Index), and horizontal support and resistance levels.
Key Observations
Price Action: The price has been consolidating in a range between the 0.618 Fibonacci retracement level and the 0.236 Fibonacci retracement level. A breakout above the 0.618 level or a breakdown below the 0.236 level could indicate a potential trend reversal.
EMA (200): The price is currently below the 200-day EMA, suggesting a bearish trend. A break above this EMA could signal a potential bullish reversal.
RSI: The RSI is currently hovering near the oversold level, indicating that the stock may be oversold and due for a bounce. However, a sustained stay in the oversold zone could suggest a continuation of the bearish trend.
Support and Resistance: The horizontal lines on the chart represent potential support and resistance levels. A break above the 0.618 level could lead to a move towards the 0.786 level, while a break below the 0.236 level could target the 0.000 level.
Potential Trading Strategies
Bullish Scenario:
Breakout: If the price breaks above the 0.618 Fibonacci retracement level with strong volume, it could signal a bullish reversal. A target could be the 0.786 level.
RSI Reversal: If the RSI rebounds from the oversold zone and starts to move higher, it could indicate a potential bullish reversal.
Bearish Scenario:
Breakdown: If the price breaks below the 0.236 Fibonacci retracement level with strong volume, it could signal a bearish continuation. A target could be the 0.000 level.
RSI Stay in Oversold Zone: If the RSI remains in the oversold zone for an extended period, it could suggest a continuation of the bearish trend.
Additional Considerations
News and Fundamentals: Keep an eye on news and fundamental factors that could impact the stock's price.
Risk Management: Always use appropriate risk management techniques, such as stop-loss orders, to protect your capital.
Note: This analysis is based on the information available on the chart and does not consider all potential factors that could influence the stock's price. It's essential to conduct thorough research and consider your own risk tolerance before making any investment decisions.
Disclaimer:- This analysis is based on the provided chart and is for informational purposes only. It does not constitute financial advice. Always consult with a financial advisor before making investment decisions. Do your own research before buying this stock because I am not SEBI registered person and this is just for educational purposes. We are not responsible for your loss.
Thanks for your support as always

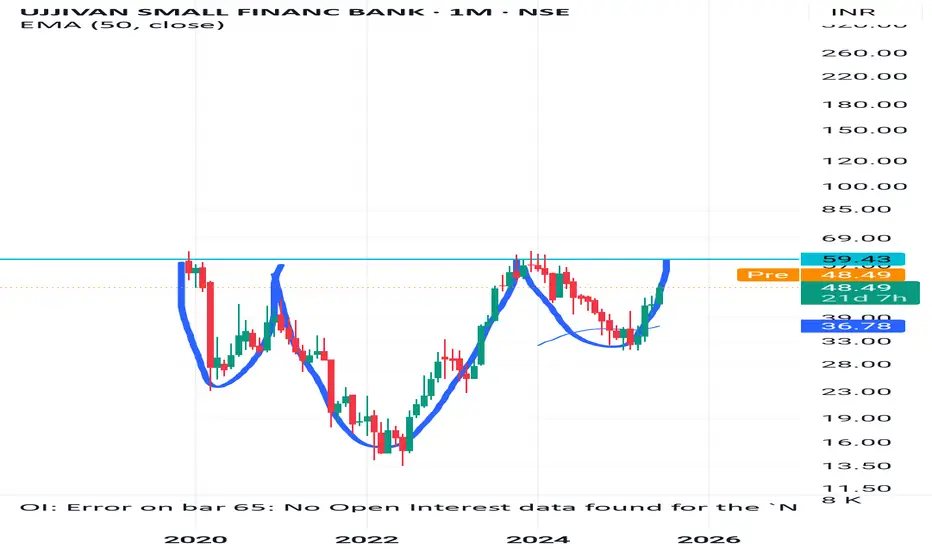
UJJIVAN SFB LONGUJJIVAN SFB looks to be taking a support and might revert back to 60 levels where it used to trade, this would probably be done when interest rates are reduced which are not far now as we know. Once the stock reaches back to 60 levels, it would have completed a cup and handle pattern which upon breakout could possibly lead to larger targets!!

Technical Analysis of Ujjivan Small Finance Bank (UJJIVANSFB)Technical Analysis of Ujjivan Small Finance Bank (UJJIVANSFB)
Overview of the Stock - The chart provides a technical analysis of Ujjivan Small Finance Bank ( UJJIVANSFB ) on a 1-hour timeframe. It employs various technical indicators to identify potential trading opportunities.
Key Indicators and Analysis
Fibonacci Retracement: The chart displays Fibonacci retracement levels, which are often used to identify potential support and resistance areas.
EMA (200, high): The 200-period Exponential Moving Average (EMA) is plotted to indicate long-term price trends. Currently, the price is below the EMA, suggesting a bearish bias.
RSI (Relative Strength Index): The RSI is a momentum oscillator used to identify overbought and oversold conditions. The current RSI value is below 30, indicating an oversold condition.
Trading Signals Based on Technical Analysis
Start Buying Above 42.50: This suggests a potential buying opportunity if the price moves above the 42.50 level. However, considering the overall bearish trend indicated by the EMA, caution is advised.
Buy More Above 40 on Reversal: This signal implies a potential buying opportunity if the price rebounds from the 40 level. Again, considering the bearish trend, this should be approached with caution.
Downward Arrow: The downward arrow indicates potential bearish pressure and a possible price decline.
Overall Outlook - The chart presents a bearish outlook for UJJIVANSFB. The price is below the 200 EMA, and the RSI suggests an oversold condition. While the indicated buying levels might offer potential entry points, it's crucial to exercise caution due to the prevailing bearish trend.
Remember: Technical analysis is just one aspect of investment decision-making. Fundamental analysis and considering broader market conditions are equally important.
Disclaimer: This analysis is based solely on the provided chart and does not consider fundamental factors. It's essential to conduct thorough research before making any investment decisions.
Thanks for your support as always

Ujjivan small finance Bank is ready to go upside?Ujjivan small finance Bank at important support level and important support and resistance are mention on the chart also and target is mention already we can see a good upside move in ujjivan small finance Bank within 1 to 2 month so let's see

44.70 ujjivan small fin bank looks great for long to mid term44.70 ujjivan small fin bank looks great for long to mid term
Sales all time high
Profit all time high
Stock down by 30% approx
Good time for a cumulation.

UJJIVANSFBUJJIVANSFB Chart Analysis 01/07/24..........
Ujjivansfb Short : Below 43
Sl : 46
Target : 30 / 23
Enjoy !

ujjivan small financeujjivan in now buy zone.. with my method now this stock is in buy zone and 1.3 rr

UJJIVANSFB / TESTING SUPPORT AREA / SMA 200The samrt money concept indicator on tradingview provides support ranges. The price is inside the support area with candle stick pattern yet to provide any of demand. The price is considerably away from its SMA 200 indicating weakness persist.

UJJIVAN - TO HIT 110Ujjaivan has formed Cup & Handle pattern and seems to be good technically to go higher from here targeting 110
SL to be considered below 38.
Excellent RR of 1:8
Disclaimer: For educational purpose only and does not constitute trading recommendation

UJJIVANSFB - Ujjivan Small Finance Bank - An Opportunity to Buy As per previous chart history and technical analysis done by me, I suggest to buy this stock at CMP@50 or wait for a DIP and buy at pullback from the zone mentioned above on the chart.
Important Disclaimer: Technical analysis is not a perfect science and should not be used alone to make investment decisions. It's important to consider other factors, such as company fundamentals, overall market conditions, and your own risk tolerance. Also I am NOT SEBI registered person to suggest any stock and this is my own personal opinion about this stock.
Thanks for your support as always

USFB May hit 82?USFB May hit 82?
Ujjivan small finance bank looking like in a turnaround phase and first accumulation happened between 13-33 range and acceleration happened from 33 onwards. but now we can see 82 in short to medium term in ujjivan small fb. but keep in mind after completing phase 3 wave will be coming back to 40-50 level once again. 20-22% may on the cards.
regards


Long ujjivan small finance bankStock making good accumulation around ipo levels... Enter at CMP 58 keeping sl 50 dcbsl... Tgt 70, 90, 110

Ujjivan Small Finance (Swing Trade BULLISH)Ujjivan Small Finance (Swing)
Buy :- 52
Trgt 1:-63
2:- 71
3:- 79
