UPL trade ideas


Upl forming acending triangleUpl is forming acending triangle any breakout can give a good move.....keep a look on it.....


UPL short term updatepowerful upmove or downmove???????
it will be decided by the market on monday.if ot breaks upper trendline go long for 918,if it breaks lower trendline go short for 788.


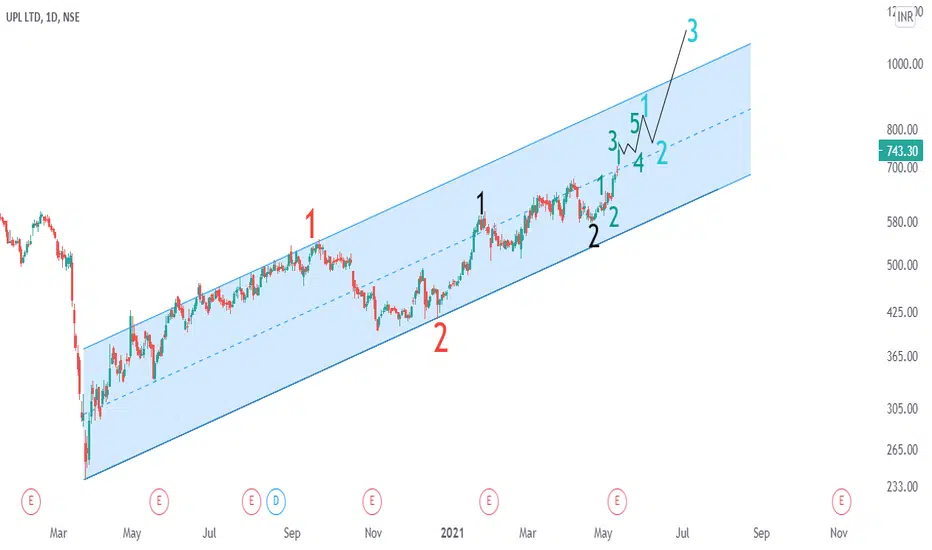
UPL Weekly EW Wave counts with Harmonic Crab Formation WIPUPL Is technically looking solid and every dip should be a buying opportunity.
Per Elliott Wave analysis Wave 3 formation in progress and we know that for any trend wave 3 is usually the strongest part of the trend. Wave 2 exactly retraced up to 0.618 FIB of Wave 1. We can also see subwaves within major Wave 3 but I will let the structure develop itself before attempting to count and measure them. At this point, a fair estimate would be to have wave 3 as 1.618 times of wave 1. We will obviously fine tune and find out a possible zone when subwaves starts to emerge with more clarity. That way we will have FIB Clusters up to which Wave 3 may go.
From the Harmonic Crab Pattern perspective, We see B Point as 0.618 retracement of X-A leg and then C point as 0.382 retracement of A-B Leg. And we know once we identify the structure with 0.618 as B and 0.382 as C, this is usually Crab Pattern with 1.618 projection on X-A leg.
I always recommend having a free account with Scott's harmonic trader website, download all the three PDF copy and read the concept. It is really amazing and accurate. From EW perspective, please read EW Wave book "Elliot Wave Principle : A Key to Market behavior" by Frost and Prechter.


UPL Shows Good Upside Potential post BreakoutTrading beyond 52 week High
Entry 745. SL (703 - 1x ATR = 703 -27) 676.
For 1: 1.5 Risk to reward ratio => Target 1 850.
For 1 lakh total Portfolio amount: Number of stocks to buy 30 (so as to not exceed 2% loss in a single trade)
Long Green Candle at Breakout. Good Volume support. Last Candle stick High Low price range > 1x ATR value. And, Open vs close price range also > 1X ATR on GREEN SIDE.
20 MA is just crossing 50 MA. Which is a great entry point

breakout from 2019 levels on weekly chartwait for it to cool down a little bit and come in 700-650 range. we can go long from there as this was previous resistance and should act as support for the stock to go higher


BO from channel patternUPL is moving up with good volumes..BO at 708...right now at 737
CMP -737
Target 816.( short term)


UPL LONG INTRADAY 4 MAY ,2021Dear trader,
If u look at the chart of UPL (analysis based intraday only) the UPL Buy at 643 and Target at 650
Best Buy at 640.
Our Best Buy is based on high quality research and when the instrument reaches this level , it’s a jackpot trade.
Best Buy level might be executed or might not be executed.
The chart clearly indicates Bullish Trend you can also see the candle stick patters for more indepth analysis.
In Intraday most important thing is to enter and exit points.
Our signals are based on analytics, algorithms, mathematical derivatives.
Always be a responsible trader, kindly trade only when you have maximum opportunity in the market with minimum risk and with keynotes like data, analysis and proper strategies.
Kindly message us for strategies and analysis.

