UPL trade ideas


UPL - Bull Flag Pattern Consolidation - Short Term BearishUPL had a great run of 260% from COVID lows to recent All Time Highs. Now the stock has taken a breather and consolidating in a bull flag . It looks like its gonna take some more time to consolidate in the channel before giving another breakout. I see the stock is bearish short term and might just test the lower end of the channel and bounce to the upper side of the channel. UPL might retest the support levels marked on the chart 674, 635 and 621. Strong support at 621 , long term buyers can start accumulating at small positions from 635 and 621 levels.


UPL weekly UPL weekly cls big RED with Tail at upper end:
on daily charts has mananged to hold the near support , friday cls is almost a Bearish Marobozu if breaks next support area visible on weekly is 765-60 zone , then deep down 700-690 and 670-660 which can act as a very strong support area, resistant 815-20 followed by 835-40

UPL closed at a make or breakUPL weekly cls:
on daily charts has maned to hold the near support , friday cls is almost a Bearish Marobozu if breaks next support area visible on weekly is 765-60 zone , then deep down 700-690 and 670-660 which can act as a very strong support area, resistant 815-20 followed by 835-40


UPL - Ready for breakoutAll details are given on chart. If you like the analyses please do share it with your friends, like and follow me for more such interesting breakout charts.
Disc - Am not a SEBI registered. Please do your own analyses before taking position. This post is only for educational purposes and not a trading recommendation.

UPL IndiaSun Storm Investment Trading Desk & NexGen Wealth Management Service Present's: SSITD & NexGen Portfolio of the Week Series
Focus: Worldwide
By Sun Storm Investment Research & NexGen Wealth Management Service
A Profit & Solutions Strategy & Research
Trading | Investment | Stocks | ETF | Mutual Funds | Crypto | Bonds | Options | Dividend | Futures |
USA | Canada | UK | Germany | France | Italy | Rest of Europe | Mexico | India
Disclaimer: Sun Storm Investment and NexGen are not registered financial advisors, so please do your own research before trading & investing anything. This is information is for only research purposes not for actual trading & investing decision.
#debadipb #profitsolutions


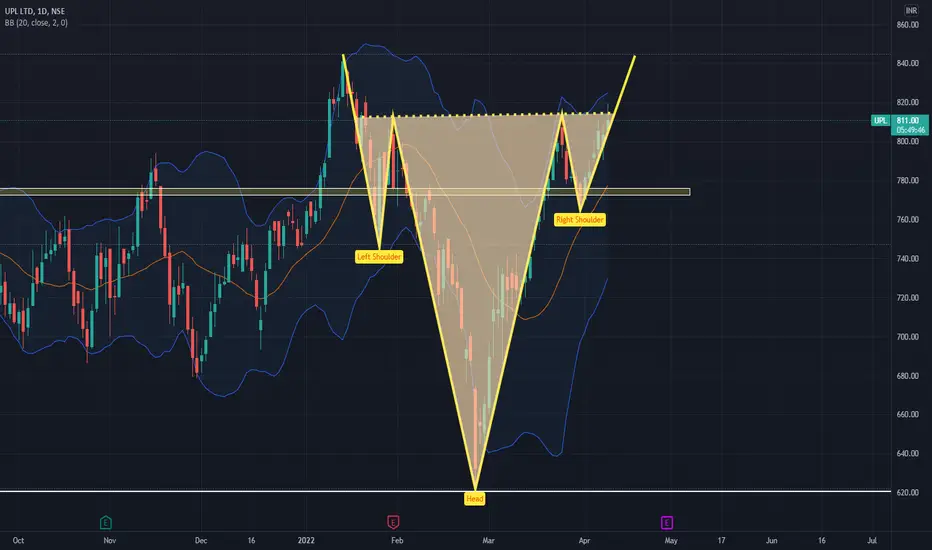
UPL 840 area has acted as multi time hurdleUPL has failed to sustain 840 area multiple times, on daily and weekly it seems it may go for a inverted HNS subject to hold 760-720 levels and then a breakout above 840 will confirm the pattern and open doors for upper levels.
I will be watching this to buy at key levels after watching PA and data near those levels.


Simple Trade Setup | UPL | 18-04-2022 [INTRADAY]NSE:UPL
Observations:
1) On 1day time frame,we can see 824 is immediate breakout level and major breakout level is at 840.
And it is forming rounding bottom pattern. as well as cup and handle type formation as well.
If these patterns gets activated then we can see good up move.
Please refer below chart : 1day time frame.
2) On 15min time frame, we can see a support trendline. If it gives breakdown of this support trendline then we can see intraday fall.
Please refer below chart : 15min time frame.
-------------------------------------
Trade Setup for 18-04-2022
1) Don't Jump in to trade at the beginning of the market. Let it get settle for 15-20min first and judge the price action.
2) Everything is mentioned on the chart. I hope it is easy to understand.
3) All the levels will work as support, resistance, entry and exit w.r.t price action near that level.
4) Avoid gap up or gap down chase. Wait and trade between levels.
Please refer below chart for levels.
Hope I made it easy to understand it.
Do comment your doubt or suggestion.
Note: Trade with Strict SL. It may or may not hit all the levels. So one can book profit / loss at respective level considering how price action works near that level.

Educational view / Expecting this / Disclaimer:- This is not A BUY OR SELL recommendation. please Consult with your financial advisor or with broker before taking any trade,
this post is for educational purpose only . warning :- do not jump directly or do not copy my trades
DO your analysis properly 3


UPL (Long)Its above 200 EMA on 1 Day chart.
Good volume coming.
about to give BO in uptrend now.
buy when resistance trendline broken or as per the buy level given on the chart.
rest all levels as mentioned on the chart.
Please do correlate by yourself also on charts. This is for paper trading and educational purpose only. Must consult your Financial advisor before investing.
