VEDL trade ideas


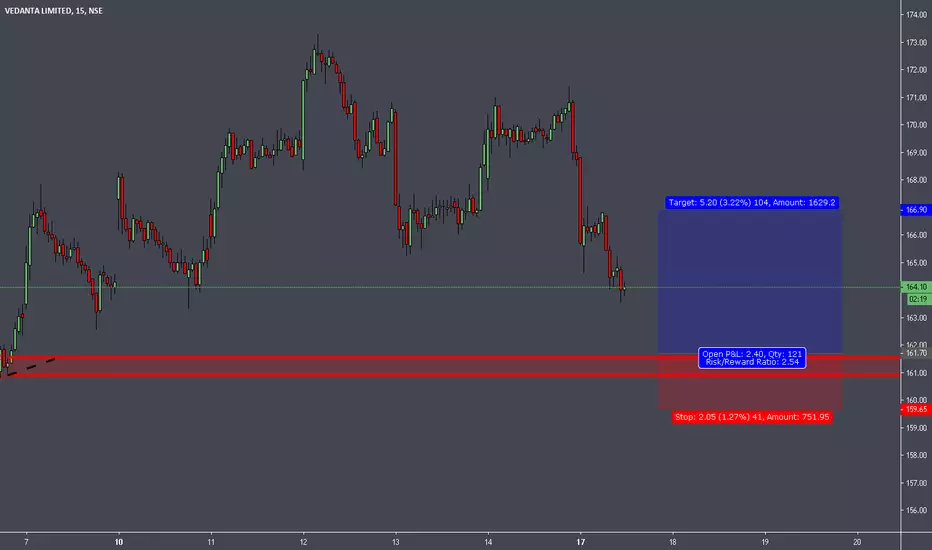
Sell Trend - VEDLAs per my view, the breakout wil happen at 5th entry in channel at downside and sell continues.
Use ABCD pattern to fix target at Fibonacci 127.2 and second target should be at Fib 161.8.


The B wave.Looking at the Daily time frame, it is highly probable that Vedanta is now entering the B wave of the ABC pattern. It is expected to ultimately test the recent high's of the A wave. Since this is a B wave, I expect to see a lot of consolidation along the way, it could be a slow and stretched move to the top. I would advise caution if selling coz the downward spikes can be quick and short. Over the next few days, Vedanta likely will try and keep going up.

VEDL appears bullish on chart but is a sell below 180VEDL is a buy above 190 and sell below 180 for 15-20% target on both side


Gap filling expectedSince it seems institutional traders have sold it with the gab in price...there is change of gab filling to take place in future in nearly months reaching target of maximum 190


VEDL trying to move in Uptrend.NSE:VEDL is trying to get back from a fall by gaining from a 52 Week low 221.60 but it still continue in downward. It struggling more to get back if it opens above 240 in coming week it ll'be back to uptrend. 240 is a breakout point.


zoom it and replay it..inspired by gann...but still need of worki belive every stock had an habit in which it move. this habit can be defined by angles of trendline, support/resistance, time taken to achieve an price level, and many more bais parameters. the relationship between price and time keeps on changing (mostly it changes near an key support or key resistance)...study the past and predict the futures.

VEDL, SupportVEDL moves mostly as Copper price moves. Price at the support zone. Copper price is also heading towards 2.900 which may give some support. Copper holding this level can give support to VEDL. Till then more downside is possible.

VEDL Positional Trade for Target of 325VEDL Positional Trade for Target of 325! SL 278! Good Risk Reward Short term Trade!


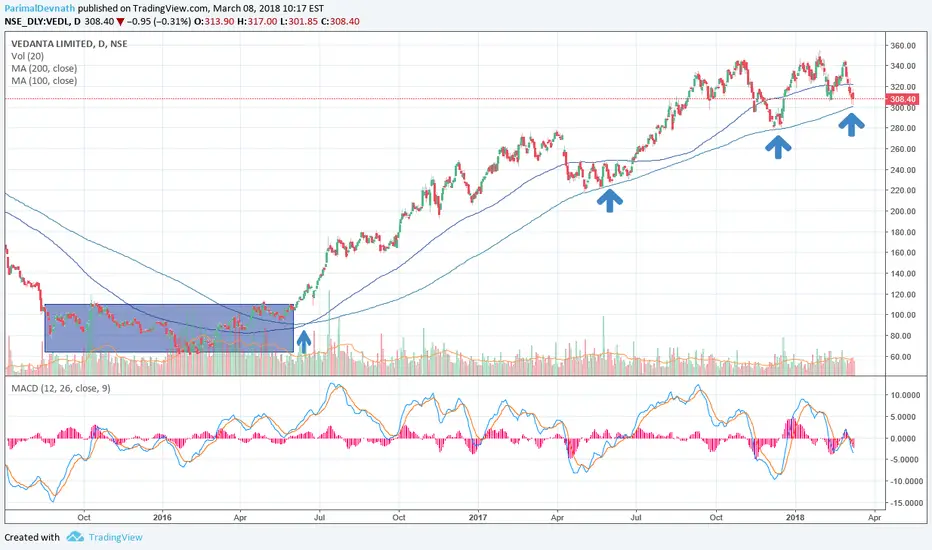
VEDL, 200DMAA bottom was created in January 2016 and since then a strong bull run has continued unabated. In June 2016 50 and 100 DMA gave a upward cross to 200 DMA which boosted the spirit of bulls. Now 350 is the strong resistance zone. So price again seeking support at 200 DMA. History repeats itself. Just as all earlier times, this time too one can expect price to head towards 350-- the resistance zone.