V I P Industries LtdVIP Industries – Consolidation with Upward Movement Supported by Strong Volume
VIP Industries is currently undergoing a consolidation phase, but within this range, the stock is gradually moving higher, supported by healthy volume. This is typically a bullish sign, as it suggests accumulation is taking place during the consolidation.
The increase in volume alongside rising prices within the range indicates buying interest and participation from stronger hands, potentially setting the stage for a breakout if the momentum continues.
VIP Industries is showing strength within its consolidation zone. The rising price action backed by strong volume is a positive technical signal, hinting at a potential breakout if current momentum sustains.
VIPIND trade ideas

VIPIND on the Move | Breakout with Rising Volumes VIP Industries (VIPIND) is showing strong momentum, backed by high volumes and a decisive breakout on the charts. The stock is gaining strength and looks promising for short-term upside. Keep this on your watchlist for potential trading opportunities.

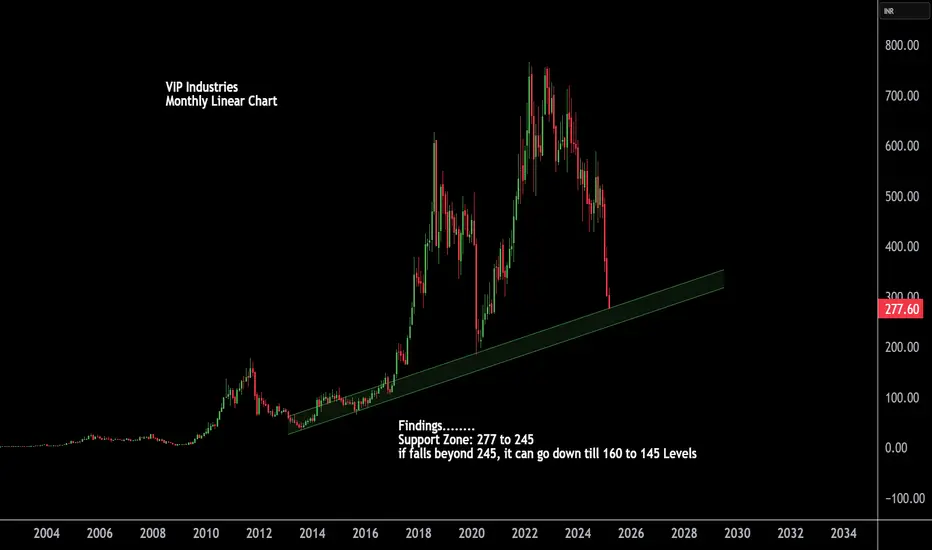
VIP Industries Trading Around Good SupportOn Linear chart one support zone is working after 64% correction,
The good Support level based on the log and linear scale chart is 277 to 245. If it breaks 250 there will be more downside till 160-145levels. There are other things also working on Log Chart as well.
VIP industries Looking stocks is at support buying zone 350/340 level
First target 450/550/600
Do your own analysis before investing

Is VIP no longer a VIP?VIP has lost its sheen for a while now...but for a bull case scenarios, it is coming to a critical area of support. You can start buying here....The green trendline is your supposed friend as support...The red trendline is the danger area....I have started buying here and will average down....will keep multiple sell orders till all time high....FIIs are still selling, so unless Nirmala Thaai can give some good news for budget, the selling will continue till most retailers are insolvent.....you know the saying the beatings shall continue till morale improves...thats what indian retail investors are going through....just remember no govt is your friend....policies still exist to extract maximum money from you....stay invested, make some profit, give the begging govt their share and give them even more when you decide to enjoy your profits....Use ur own risk management.....


Breakout Strategy: Swing Trade Opportunity with Price Action.This swing trade idea focuses on breakout setups, using price action to identify key levels. When price breaks through support or resistance, it signals a potential trend continuation. The strategy aims to capitalize on momentum after the breakout, with clearly defined entry, stop-loss, and target levels for effective risk management.
stock name: VIPIND

Sunteck Realty LimitedSunteck Realty Limited, Fundamentally strong, with Rsi bulish divergence let price retrace to fib golden zone or below and plan your trade accordingly with proper risk management.

TRENDLINE BREAKOUT IN VIP INDUSTRIES...NSE:VIPIND trade at 510. Stocks has given a trendline breakout. You can watch for an upside move at 650-700...

VIP INDUSTRIES - Looking good for upside
At Good support Level
Price has corrected without any significant volumes.
Accumulation taking place
Risk Reward is favorable.
Disclaimer: Only for educational purpose

SWING IDEA - VIP INDUSTRIESVIP Industries , a leading manufacturer of luggage and travel accessories, is displaying technical indicators that suggest a promising swing trading opportunity.
Reasons are listed below :
450-500 Strong Support Zone : The 450-500 level has been established as a strong support zone, providing a solid base for potential upward movement.
Bullish Engulfing Candle on Weekly Timeframe : The formation of a bullish engulfing candle on the weekly chart indicates strong buying pressure and suggests potential for further upward movement.
Daily Candle Engulfed 7 Daily Candles : The recent daily candle has engulfed the previous 7 daily candles, demonstrating significant buying interest and a potential shift in trend.
Golden Fibonacci Zone : The stock is finding support at the golden Fibonacci retracement level (0.618), a key area where prices often bounce back, indicating potential for an upward move.
Increased Volumes : A noticeable increase in trading volumes confirms the strength of the price move and indicates growing investor interest.
Target - 575 // 660 // 715
Stoploss - weekly close below 445
DISCLAIMER -
Decisions to buy, sell, hold or trade in securities, commodities and other investments involve risk and are best made based on the advice of qualified financial professionals. Any trading in securities or other investments involves a risk of substantial losses. The practice of "Day Trading" involves particularly high risks and can cause you to lose substantial sums of money. Before undertaking any trading program, you should consult a qualified financial professional. Please consider carefully whether such trading is suitable for you in light of your financial condition and ability to bear financial risks. Under no circumstances shall we be liable for any loss or damage you or anyone else incurs as a result of any trading or investment activity that you or anyone else engages in based on any information or material you receive through TradingView or our services.
@visionary.growth.insights

VIP IndustriesVip Industries
CMP 471
Good Support At 421-391
Buy In Dips
Long Term Good Support At 319

VIP - Bad times?🎯 The chart is self-explanatory as always.
🎯 After 2.5 years of consolidation, The price broke below the 500 level.
🎯 The price is below the 50,100 and 200 DEMA & WEMA
🎯 Looks like tough times ahead?
🎯 Immediate support is marked.
What do you think of this price actin? Comment below...
⚠️Disclaimer: We are not registered advisors. The views expressed here are merely personal opinions. Irrespective of the language used, Nothing mentioned here should be considered as advice or recommendation. Please consult with your financial advisors before making any investment decisions. Like everybody else, we too can be wrong at times ✌🏻

Vip Industries LimitedVip Industries Limited, looking for good if comes in demand zone as marked in chart


VIP IndustriesTarget given in the chart
SL - As per your apetite , Valuation is abit on the higher side.
Market Cap
₹ 7,749 Cr.
Current Price
₹ 546
52 W High / Low
₹ 723 / 449
Stock P/E
78.6
Book Value
₹ 50.4
Dividend Yield
0.82 %
ROCE
27.8 %
ROE
29.0 %
Face Value
₹ 2.00
Price to book value
10.8
Intrinsic Value
₹ 158
PEG Ratio
12.0
Price to Sales
3.56
Debt
₹ 529 Cr.
Debt to equity
0.74
Int Coverage
3.67
Reserves
₹ 687 Cr.
Promoter holding
51.8 %
Pledged percentage
0.00 %
EPS last year
₹ 10.8
Net CF
₹ 15.8 Cr.
Price to Cash Flow
44.3
Free Cash Flow
₹ 69.1 Cr.
OPM last year
15.2 %
Return on assets
13.2 %
Industry PE
68.8
Sales growth
9.64 %

3 black crows VIP industries last 15 minute candle shows 3 black crows with high volume.so we can take short sell

Accumulate vip industries for long termStill a long term bet opportunity with rising tourism and travel
Can except good 20% returns in medium term

VIPIND : Best Swing Trading OpportunityVIP Industries has given Zero Returns from last 3 years
VIP Industries Stock currently around the support which was working as Resistance.
Stock has also formed Falling channel in short term and now around 500 levels is coming support from these 2 factors.
So stock is around the support and looking good for swing trading !
Disclaimer : We are not SEBI registered analyst. Do your own research before taking any investment decision.
#stock #stockmarket #investing #money #finance #trading #investment #VIP #VIPIND

VIP INDUSTRIES CHARTTechnical Analysis of VIP Industries Chart: Wave Sequence and Current Outlook
This research provides a concise overview of the wave sequence observed in the chart of VIP Industries. The analysis covers four waves, detailing their completion points and current status, with a focus on the ongoing Wave 4. The possibility of an "abcde" pattern formation within Wave 4 is highlighted, indicating potential reversal points around the 480-490 level, corresponding to 38.2% of the Wave 3 upward movement. It is crucial to note that the author is not a SEBI registered analyst, and readers are advised to consult their financial advisors for investment-related inquiries.
Key Points:
Wave Sequence Overview:
Wave 1 completed at 36 on 19 Sep 2005.
Wave 2 completed around 7/- in Mar 2009.
Wave 3 completed around 775 in Apr 2022.
Current Status - Wave 4:
Wave 4 is currently in progress.
The possibility of an abcde pattern is suggested.
Anticipated reversal level: 480-490, representing 38.2% of the Wave 3 upward movement.
Important Disclaimer:
The author is not a SEBI registered analyst.
Readers are advised to consult their financial advisors for investment-related
Warm regards

VIPINDNSE:VIPIND
Todays closing candle formation in Inverted Hammer
Showing reversal pattern
Buy above- 557
Stop Loss-503
Target- 600/615/646/661/690
Tripple bottom trading at major support line.


VIP IndustriesVIP industries looks a good buy looking at the long term trend channel dating back to year 2001.
The given scrip has undergone a good volume expansion in previous uptrend and is consolidating for quite some time. The Blitzkrieg volume blazer indicator shows a good volume support in the uptrend & 50 point volume weighted moving average is acting as a great cushion for the stock.
Currently the stock is exactly at the bottom of the trend channel & on the upside of the trend channel the targets look to be 4000+
Company has solid fundamentals with a steadily growing revenue, with a falling Bangladeshi currency the company is all set to have a heavy margin expansions.
P.S: Given is just information sharing and is not any buy or sell recommendation. Please consult your SEBI registered financial advisor before making any investment or trade as stock markets are subject to market risk
