VOLTAS In breakoutNSE:VOLTAS in breakout. As it approaches the key level of 1390, I recommend buying once it decisively crosses that threshold. With bullish momentum building, we can set our sights on the first target at 1480 and an ambitious second target at 1565!
Remember, investing requires careful analysis and risk management. Stay informed, and let’s navigate this market together! What are your thoughts? Are you eyeing VOLTAS or any other stocks for potential growth? Let’s discuss in the comments below! 💬💰 #StockMarket #InvestmentStrategy #VOLTAS #BreakoutTrading
VOLTAS trade ideas

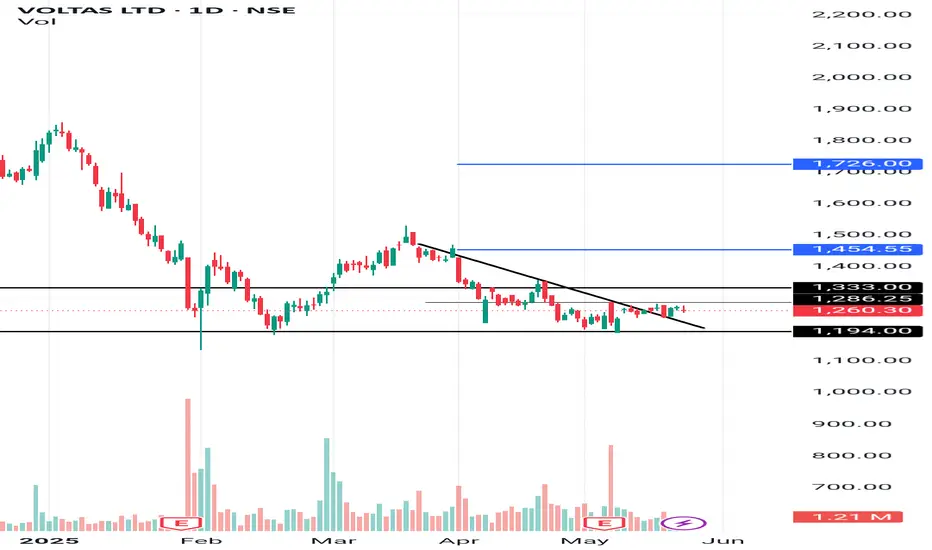
VOLTAS in BreakoutNSE:VOLTAS in Breakout! Falling trendline breakout in Prices and RSI indicate Positive. Target would be 1350

A Step-by-step Guide to One of the Chart Analysis Method: VOLTASHello Friends,
Welcome to RK_Chaarts,
Today we're going to learn step-by-step guide to one of the chart analysis Method by analyzing a chart of " VOLTAS LTD. " to identify a trend change opportunity.(Educational Post).
Let's get started!
Applying Elliott Wave Theory
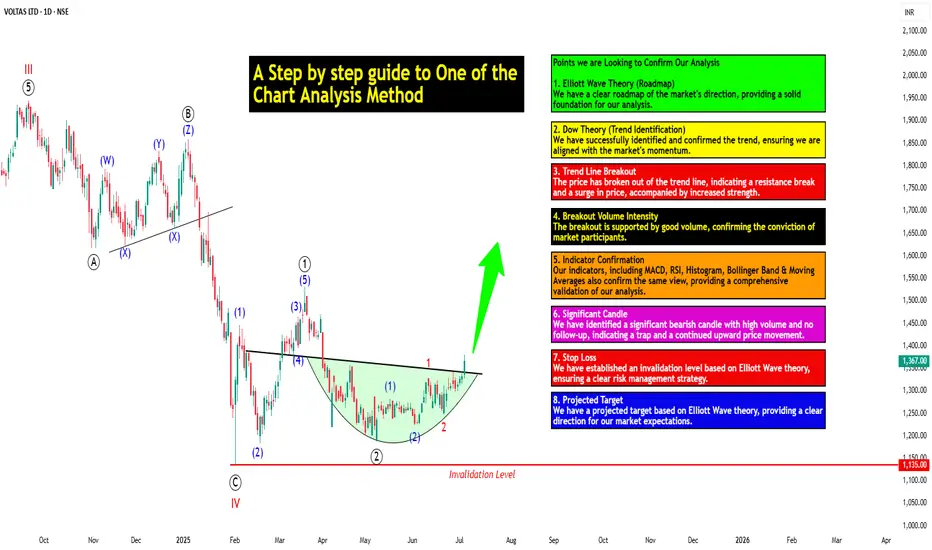
According to Elliott Wave theory, we can see that the high of September 20, 2024, marked the end of the wave III of the cycle degree in Red. After that, a corrective wave unfolded, which reached its low on February 1, 2025. This was the wave IV of the cycle degree in Red, with a low of 1135.
The approximately 6 months correction ended here, and now the wave V of the cycle degree in Red has begun. Within this, there will be five sub-divisions of primary degree in black, which we can label as waves ((1)) to ((5)). Of these, waves ((1)) and ((2)) are complete, and we are possibly now in wave ((3)) of the Primary degree in Black.
Within wave ((3)), there will be five sub-divisions of intermediate degree in blue, of which waves (1) and (2) are complete, and the (3)rd intermediate degree in Blue is underway. Within this, there will be five sub-divisions waves of minor degree in red, of which 1 and 2 are complete, and today we saw the breakout of the 3 of the (3).
Possibly, this is a momentum move according to Elliott Wave theory, which we can call the third of the third of the third.
Now that we have this low of wave IV at ₹1135, it should not go below this level according to Elliott Wave theory. If it does, our current wave count will be invalidated. That's why we have an invalidation level within Elliott Wave, which according to this chart is at ₹1135. This low should not be breached. If it is breached for any reason, we'll have to re-analyze our entire count, and the counts could be different.
However, if this low holds, then the minimum target for wave V, based on the projection of wave theory, would be at least 100% to 123% of the fall from top III to bottom IV, which could take it to around ₹2000 to ₹2100. Shown in chart image below
Possible Elliott Wave Counts on Daily Time Frame Along with Invalidation level & Target levels.
Dow Theory Suggests now Up Trend
After forming the top of wave III, we can see that the price has moved downwards in a pattern of lower highs and lower lows. However, after completing the bottom of wave IV, the price has started forming a pattern of higher highs and higher lows, indicating that an uptrend has begun.
This is a clear signal that supports our wave counts moving upwards, i.e., towards an impulse move, based on Dow theory. The successful completion of wave IV and the initiation of the higher highs and higher lows pattern suggest a strong bullish trend, and we can expect the price to continue moving upwards. Shown in chart image below
Breakout with good intensity of Volumes
In this chart, we've observed a rounding bottom type chart pattern, and today, we've seen a breakout above the upper resistance trend line. Today's candle volume is also significantly higher than the average. Shown in chart images below
Chart Pattern: Rounding Bottom
Resistance Trendline Breakout with Good Intensity of Volumes
Supporting Indicators & Moving Averages
Also we can see that the current price has closed above the 50-day EMA and 100-day EMA. Additionally, indicators like RSI is above 60 and showing momentum, MACD is positive and above the zero line, and the histogram is also showing a breakout. Shown in chart images below
Breakout above 50DEMA & 100DEMA
RSI Breakout above 60+ on Daily Time Frame
Bullish side Breakout in Histogram on Daily Time Frame
MACD running Positive & above zero line on Daily Time Frame
Bollinger Band on Weekly
If we look at the weekly time frame, the current week's candle is above the middle Bollinger Band, indicating that the price is above the 20-period simple moving average on the weekly time frame. which is very good sign. Shown in chart image below
Price Trading above 20 SMA on Weekly Time Frame (Mid.Bollinger Band)
Significant Observation in Price Action & Volumes
Before the breakout, the rounding bottom chart pattern that was forming at the bottom can be interpreted as accumulation, as a red bearish candle with high volume appeared, marking the highest volume. Notably, no candle has closed below the low of that candle since then.
Although a gap-down candle occurred, it opened and closed bullish, indicating no selling pressure below that level. The absence of bearish follow-up and the subsequent breakout today are significant observations, combining price action and volume. This is a positive sign suggesting the price may move upwards. Shown in chart image below
This is how chart analysis is done for investment purposes. We've seen many signs in our favor, and yet we still use a stop loss to prevent significant losses in case the stock or market moves unexpectedly. This is what stop loss is all about - minimizing potential losses.
We've also discussed the target projection based on Wave theory, 123.6% level, which we explained through an image. So, friends, I hope you've understood the entire conclusion and learned how to analyze charts using different methods, one of which we shared with you today.
I am not Sebi registered analyst.
My studies are for educational purpose only.
Please Consult your financial advisor before trading or investing.
I am not responsible for any kinds of your profits and your losses.
Most investors treat trading as a hobby because they have a full-time job doing something else.
However, If you treat trading like a business, it will pay you like a business.
If you treat like a hobby, hobbies don't pay, they cost you...!
Hope this post is helpful to community
Thanks
RK💕
Disclaimer and Risk Warning.
The analysis and discussion provided on in.tradingview.com/u/RK_Chaarts/ is intended for educational purposes only and should not be relied upon for trading decisions. RK_Chaarts is not an investment adviser and the information provided here should not be taken as professional investment advice. Before buying or selling any investments, securities, or precious metals, it is recommended that you conduct your own due diligence. RK_Chaarts does not share in your profits and will not take responsibility for any losses you may incur. So Please Consult your financial advisor before trading or investing.
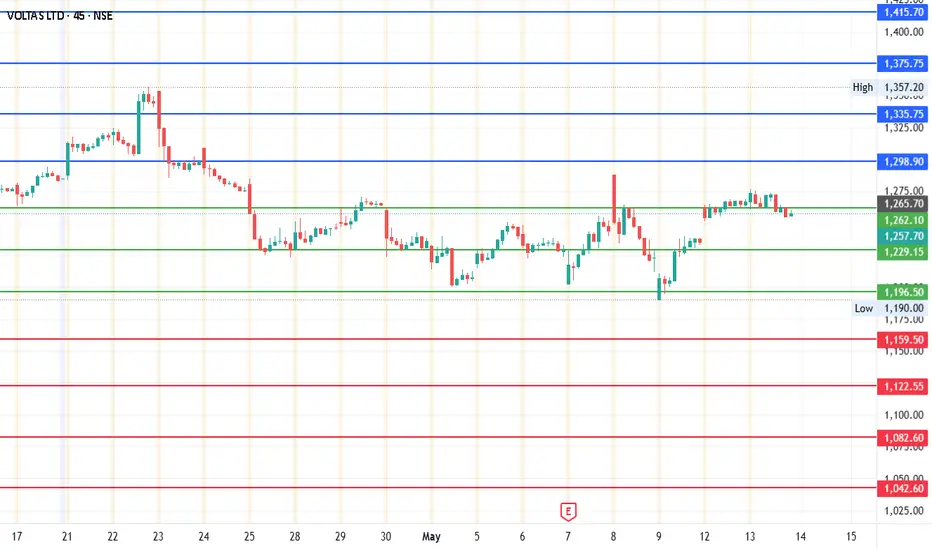
Voltas - Short TermCurrent Price: 1257.7
Mid-point: 1229.15
Upside Targets: 1298.91, 1335.75, 1375.73 and 1415.70
Downside Targets: 1159.52, 1122.55, 1082.58 and 1042.60
Support: 1196.49
Resistance: 1262.08
#Voltas
#VoltasChartPatterns


Voltas in demand zone consider with proper Stop Loss Voltas consider at CMP
with Strick SL 1125
Target of 1355, 1470
do your own analysis and your risk factor before make any investment decision

Voltas India Ltd view for Intraday 8th May #VOLTAS Voltas India Ltd view for Intraday 8th May #VOLTAS
Resistance 1260 Watching above 1263 for upside movement...
Support area 1230 Below 1240 ignoring upside momentum for intraday
Watching below 1228 for downside movement...
Above 1240 ignoring downside move for intraday
Charts for Educational purposes only.
Please follow strict stop loss and risk reward if you follow the level.
Thanks,
V Trade Point

Voltas LtdTrading near support level of 1200.
Invest or trade at your own risk.
Consult your financial advisor before Trading or investing.

VOLTAS LTDElectrical, heating, ventilation, and air conditioning, plumbing, firefighting, additional low voltages, and specialised services are all included in the Electro-Mechanical Projects and Services section. Mining and construction equipment, as well as textile machines, are included in the Engineering Products and Services sector. The Unitary Cooling Products for Comfort and Commercial Use division manufactures, markets, and provides after-sales services for cold storage and cooling equipment.
I saw that it has corrected by about 35–40% from its peak, and I believe it is now available at this favourable price. It can be accumulated with the SL 1245-40 above 1287 as a positional base. I believe that after it reaches the 1287 level, it might attempt to reach 1360, 1450, or 1520.
This is only for educational purposes; before making any investments, consult with your advisor.

Voltas Ltd Trading Around Long Term SuopportA strong long-term support level on Voltas Ltd.'s monthly log scale chart, which has held firm since 2000. Using this support zone. It's a straightforward chart with simple technical analysis.

Voltas - bulls working off the trendlineStock has corrected sharply from c1200 levels. trendline support has been projected with marginal overreach
Stretched valuations have become far more reasonable
Good levels to start looking at longs

Good Price to Accumulate for Long TermCurrent price is trading at 3 times to Revenue/share which is on the lower side of it's historical valuation. Revenue has been growing over the years and it is trading at a good valuation. What else is needed to call it a good buy? Happy Investing :)

Voltas LtdVoltas is engaged in the business of air conditioning, refrigeration, electro - mechanical projects as an EPC contractor both in domestic and international geographies (Middle East and Singapore) and engineering product services for mining, water management and treatment, construction equipments and textile industry.
Voltas was created 6 decades ago when Tata Sons joined hands with a swiss company Volkart Brothers. Voltas is also one of the most reputed engineering solution providers specializing in project management.
The company has 5,000+ Customer sites actively managed across India
Key Points :-
Unitary Cooling Products(UCP)
Unitary Cooling products comprises Room Air
Conditioners (RAC), Air Coolers, Air Purifiers, Water Heaters, Water Dispensers, Water Coolers, Visi Coolers, Chest Freezers, Cold Rooms & Medical Refrigeration.
Voltas Beko
It is a JV with a Turkish company Arçelik through which Voltas entered the home appliances industry under the brand, Voltas Beko in 2018. The company produces refrigerators, washing machine, microwaves and dishwashers. 5.2% market share.
International Operations Business Group (IOBG)
The company operates in Mechanical, Electrical & Plumbing (MEP), Heating, Ventilation and Air Conditioning (HVAC) and Water Management. IOBG specializes in providing comprehensive electromechanical solutions and services to its
clients in Middle East and Asia region. The company has successfully completed multiple projects across GCC, including Dubai, Oman, Qatar, Bahrain etc.
Universal MEP Projects & Engineering
Services Limited (UMPESL)
Offerings - MEP,HVAC, Water Infrastructure, Electrical & Solar Projects, O & M.
The company has restructured their B2B business into this segment. The company has an order book of ~Rs. 4,770 crs. as of Q1FY25. It completed Water Projects of SAIL, Bokaro & Rourkela and OWSSB Cuttack.
Textile Machinery Division(TMD)
Offerings - Capital Machinery, Accessories, Allied Machinery, After-sales Services.
Export decline in cotton yarn and textiles led to lower spinning mill utilisation.
Mining and Construction Equipment (M&CE)
Offerings - O & M, Crushing & Screening Machinery.
M&CE has grown its business across India and
expanded to Mozambique through partnerships with Tata Mozambique and Tata Africa.
Vestfrost Solutions, Denmark
In FY23, the company entered into a technology license agreement with Vestfrost Solutions, Denmark, to develop, manufacture, sell and service medical refrigeration and vaccine storage equipment. This will enable the compant to enter the Bio Medical and
Cold Chain industry for vaccine storage equipment such as ice-lined refrigerators, vaccine freezers, and ultralow temperature freezers, in the Indian market.

Review and plan for 6th March 2025 Nifty future and banknifty future analysis and intraday plan.
dxy, few stocks analysed.
This video is for information/education purpose only. you are 100% responsible for any actions you take by reading/viewing this post.
please consult your financial advisor before taking any action.
----Vinaykumar hiremath, CMT

Voltas' Strong Recovery on the CardsNSE:VOLTAS – Strong Recovery & Breakout Potential! 🚀
📌 Current Price: ₹1,410.00
📌 Target Price: ₹1,645.15 (+15.55%)
📌 Recent Trend: Reversal from Bottom 📉➡️📈
✅ Bullish Momentum Picking Up 🔥
✅ Key Resistance at ₹1,437.55 - Potential Breakout Level 📊
✅ Upside of 15.55% If Breakout Holds 🚀
What’s your take? Will this breakout succeed?
Drop your thoughts! 🔥💬
#StockMarket #Voltas #Breakout #Trading #Investing

Voltas Trading Near Multiyear SupportAfter a strong corrections now price trading near multiyear support (near 1100) low risk zone for any stock and 200 week SMA also crossed near this level .

Voltas is ready to fly in blue sky, a perfect swing trade setupHello everyone, i hope you all will be doing good in your life and your Trading as well. Today i have brought a company from a TATA Group. Stock name is Voltas and it is engaged in the business of air conditioning, refrigeration, electro - mechanical projects as an EPC contractor both in domestic and international geographies (Middle East and Singapore) and engineering product services for mining, water management and treatment, construction equipments and textile industry.
Voltas was created 6 decades ago when Tata Sons joined hands with a swiss company Volkart Brothers. Voltas is also one of the most reputed engineering solution providers specializing in project management. The company has 5,000+ Customer sites actively managed across India
Unitary Cooling Products(UCP)
Unitary Cooling products comprises Room Air
Conditioners (RAC), Air Coolers, Air Purifiers, Water Heaters, Water Dispensers, Water Coolers, Visi Coolers, Chest Freezers, Cold Rooms & Medical Refrigeration.
As of Q1FY25, company has 21.2% market share in room Acs and 36% in window ACs . It has 30,000+ touchpoints, 330+ EBOs and 5 Experience Zones. The company sold 1 mn units in 88 days.
Market Cap
₹ 46,365 Cr.
Current Price
₹ 1,401
High / Low
₹ 1,946 / 1,013
Stock P/E
65.4
Book Value
₹ 190
Dividend Yield
0.39 %
ROCE
8.51 %
ROE
4.40 %
Face Value
₹ 1.00
Industry PE
82.8
Debt
₹ 871 Cr.
EPS
₹ 21.7
Promoter holding
30.3 %
Intrinsic Value
₹ 272
Return over 5years
15.1 %
Debt to equity
0.14
Net profit
₹ 709 Cr.
Disclaimer:- This analysis is for educational purposes only. Please trade responsibly and consult a financial advisor before making any decisions.
If you found this analysis helpful, don’t forget to like, follow, and share your thoughts in the comments below! Your support keeps me motivated to share more insights. Let’s grow and learn together—happy trading!

Voltas - Triple Top Break Down and Neck line brokenVoltas had triple top breakdown and it will have possible following targets;
1620 / 1550 / 1525

Voltas Ltd - Elliott Wave Analysis Update - Target Achieved**Voltas Ltd - Elliott Wave Analysis Update 📊**
🎯 **Target Achieved! Trade Executed Successfully** 🚀
The Elliott Wave structure for Voltas played out precisely as anticipated, delivering a successful breakout and hitting the target zones. Here’s a detailed recap of the movement:
---
### 🔍 **Key Highlights from the Chart Update:**
1️⃣ **Wave Structure Resolution:**
- The stock successfully broke above the critical resistance level of ₹1,821.30, confirming the continuation of the bullish Wave (Y).
- Price surged towards the projected ₹1,900+ zone, fulfilling the target set for this corrective pattern.
2️⃣ **Momentum Confirmation:**
- Trading above the 50-day Moving Average provided a solid foundation for sustained upward momentum.
- Strong buying volumes at key Fibonacci retracement levels fueled the rally, validating the demand in the identified zones.
3️⃣ **Trade Execution:**
- **Entry Point:** Initiated near ₹1,790 after observing the breakout above ₹1,821.30.
- **Exit Point:** Target successfully achieved at ₹1,900+, locking in significant gains.
- **Risk Management:** Stop-loss placed below ₹1,800 remained untouched, ensuring a favorable risk-reward ratio.
---
### 🚨 **Lessons & Next Steps:**
- **Critical Support Levels:** ₹1,821.30 now becomes the immediate support, with ₹1,641.35 as the long-term cushion.
- **Potential Future Resistance:** Monitor price action near ₹1,950–₹2,000 for signs of consolidation or trend continuation.
---
🔥 **Conclusion:**
This trade highlights the effectiveness of combining Elliott Wave analysis with momentum and volume indicators. Voltas continues to exhibit a strong technical structure, making it a stock to watch for further opportunities.
🔔 **Follow us for more updates and insights into market movements!** 🚀✨

Voltas Ltd - Elliott Wave AnalysisVoltas Ltd - Elliott Wave Analysis 📊
🎯 Target Zones Identified!
The Elliott Wave structure for Voltas suggests a potential Zig-Zag correction with alternating patterns leading towards critical support and resistance zones.
🔍 Key Highlights from the Chart:
1️⃣ Wave Structure in Progress:
Current price action aligns with an ongoing corrective phase, alternating between support at ₹1,641.35 and resistance at ₹1,821.30.
The chart confirms higher low formations, indicating buying interest around the lower boundary.
2️⃣ Momentum Indicators:
The stock is currently trading above the 50-day Moving Average, suggesting sustained positive momentum.
Significant buying volumes at key Fibonacci retracement levels highlight strong demand.
3️⃣ Next Potential Levels:
A breakout above ₹1,821.30 may confirm a bullish wave (Y) continuation towards ₹1,900+.
Failing to hold above ₹1,641.35 could signal further downside correction.
🚨 Risk Management Reminder:
Place stop-losses effectively below ₹1,600 to mitigate risks during volatile market phases.
🔥 Conclusion:
Voltas is demonstrating a clear Elliott Wave corrective pattern. Keep an eye on ₹1,821.30 for bullish breakout opportunities or ₹1,641.35 for critical support.
🔔 Follow us for actionable insights and updates on market movements! 🚀✨

voltas swing tradeHello,
Trend-Based Analysis. Buy the Dips, Sell The Rallies, Also Following the Trend. Let's see where the Price Action takes us, Riding the wave. Potential trade setups based on trend momentum.
Technical analysis based on trend identification and momentum, Looking for high-probability setups within the prevailing trend.
Analyzing the current market trend and potential future price movement. Focusing on risk management and reward-to-risk ratios.
Details is Mentioned in Chart, Read carefully.. .
