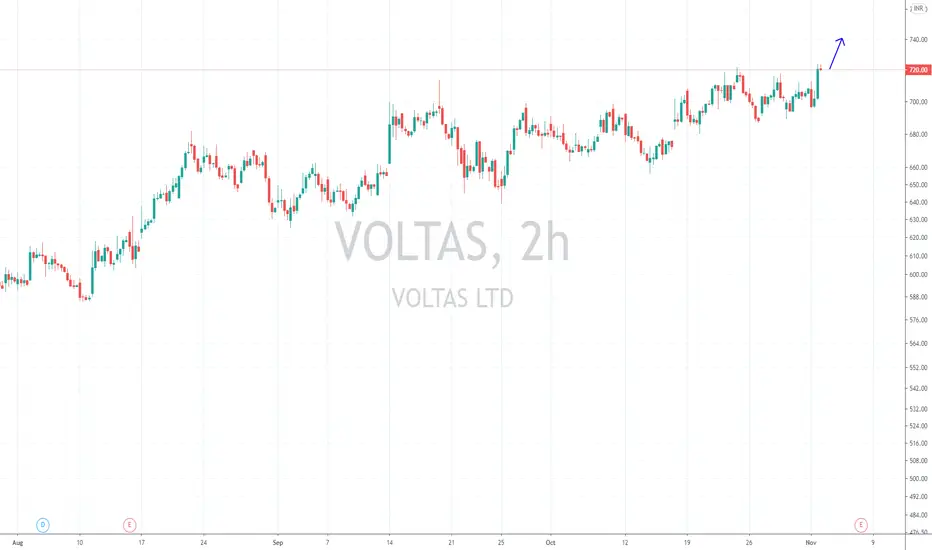
Voltas-700+ Voltas gonna cracy after channel breakout and will test 700... Previosuly voltas broke strong resistance and now formed flag pattern... Fully bullish IMHO... May halt at 640 as its a major resistance ...Targets on chart...
VOLTAS trade ideas

Voltas - Intraday / Swing Trade Setup Voltas CMP - 720.45
Looking bullish in higher time frame. One can go for Intraday / Swing trade setup with the following entry, exit & targets
Buy at or above ONLY 723 / Stop Loss 714
Target 1 - 728
Target 2 - 735
Target 3 – 740 / 745
Disclaimer: This is my view and for educational purpose only. Trade according to your risk and am not responsible for your loss.
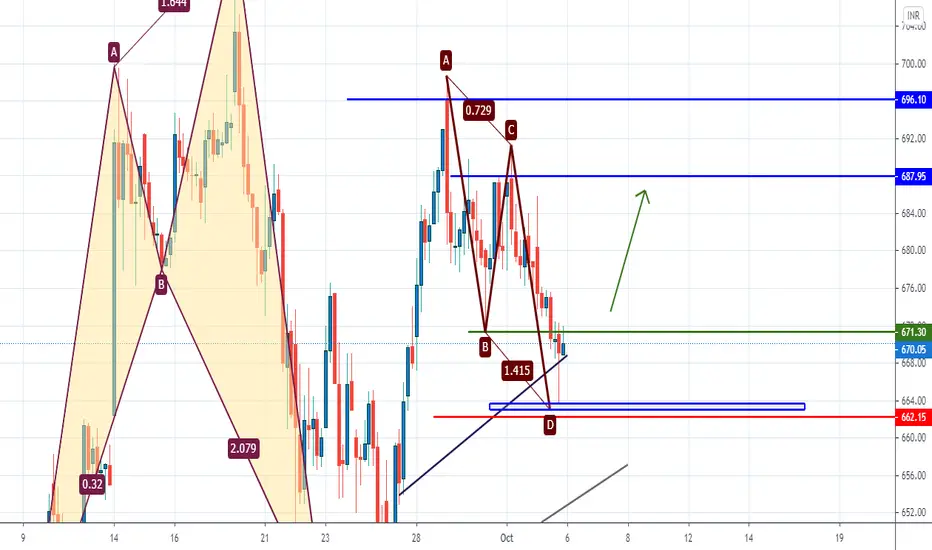
#Voltas - Will it break 740 !!#Voltas
Expected to trend ahead of level 740...
Retest may happen at/till 650..
Let see !!
@ finspire - 18.10.20


Voltas - Bullish FlagVoltas is forming a bullish flag pattern in the daily time frame. Looks good if it gives a breakout above 680.

VoltasShort Set Up:- As Per Hourly Chart Voltas is showing some weakness as RSI indicating first 60 Resistance

#Voltas give move on card 750-850-900 near term.#VOLTAS has given weekly positive reversal from 640 low level with strong volume confirmation, prices have given a strong bounce from previous tops and strong 100/200 WMA with RSI above 60+ is suggesting a big move on card 725-750-850-950 in the near term.


VOLTAS set up for this weekImportant support / resistance levels shown....Possible movement of this stock for this week and days to come....


voltas upcoming target voltas cmp 448/440 with sl-420 upcoming target upside - 700-740 holding till 30-sep-2020

VOLTAS BULLISH TRADE SETUPREFER CHART TO KNOW THE ENTRY,EXIT AND TARGET
VOLTAS IS NEAR THE TRENDLINE SUPPORT SO LETS WAIT FOR THE TRAINGLE PATTERN TO BREAK SO THAT WE CONFIRM THAT THE TREND IS CONTINUING

Voltas is looking good to buy for target of 700-750Voltas is looking good to buy for target of 700-750


Swing trade opportunity with 15-20% expected gains.
Everything is mentioned in the screenshot itself.
NSE:VOLTAS

VOLTASNSE:VOLTAS
THIS WAS SPOTTED NEAR THE SAME LEVELS FOR UPMOVE ON 18TH AUGUST, AND IT JUMPED 40 POINTS FROM OUR LEVELS
NOW IT HAS ONCE REACHED ONCE AGAIN TO ITS SUPPORT OF 645, NOW THIS IS THE MAKE OR BREAK LEVELS
IF THIS BREAK, YOU GONNA SEE 638, 628, 625 AND 618, ELSE AGAIN UPSIDE TOWARDS 663 AND 680
**********************************************************************************************************************************************
Hi all,
Its pleasure to have you all here.
I have started putting these charts as a contribution from my side to all people who are new to business, as I had to struggle a lot without any sources at disposal. So please consider this a just small contribution from my side.
Few Honest Disclosures:
1. Any idea shared is my personal view, its not a recommendation, neither any kind of paid propaganda, so please
do your bit of research.
2. Ideas shared does not mean that I trade all or have position in them, this is just a helping hand to all.
3. I expect no comments or like nor any negativity, as I said its just a small helping hand from my side, please plan your risk and trade as per your capacity.
4. To trade in Cash, options or futures is your sole choice and your own risk
5. I am no expert in Tech Indicators, I believe in support resistance and trendline theory, you may use this as a supplement theory for better results.
6. I work for my own living, this is a hobby which I do sincerely to help anyone who might come across my charts.
**********************************************************************************************************************************************


Voltas Clear range Breakout Target 670 !!The stock has been consolidating for a while and gave clear breakout
Can be bought with Target of 670 levels with a stop loss of 620 on closing basis
