VOLTAS in the buying ZoneVoltas is forming divergence, however not as strong as desired. But it gives a good buying opportunity for positional trades here. I will buy 25% of my intended investment for Voltas here and keep buying if new lows and divergences found. But, I wont buy and just hold what I have bought if it moves up from here.
There is no stop loss, as I will keep averaging for another 75% and then hold.
One year target at least 20-30%
Will keep updating !!!
VOLTAS trade ideas

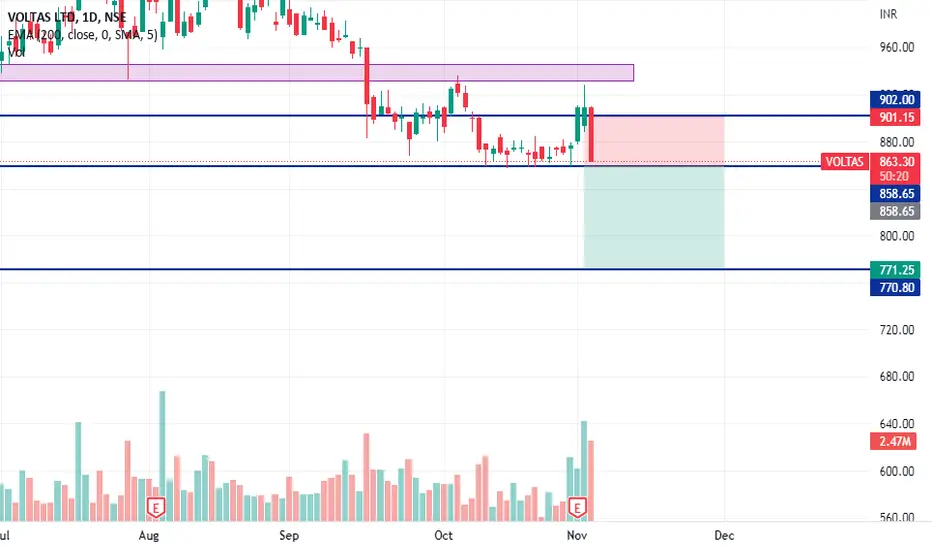
Voltas breakout signal for short voltas short entry activates by closing under 858
Stop Loss at 902
Target at 770
Please follow us we publish swing trades every day
Voltas Levels & Strategy for Medium TermDear traders, I have identified chart levels based on my analysis, major support & resistance levels. Please note that I am not a SEBI registered member. Information shared by me here for educational purpose only. Please don’t trust me or anyone for trading/investment purpose as it may lead to financial losses. Focus on learning, how to fish, trust on your own trading skills and please do consult your financial advisor before trading.
My Strategy: Sell on rise only????? Please share your thoughts.

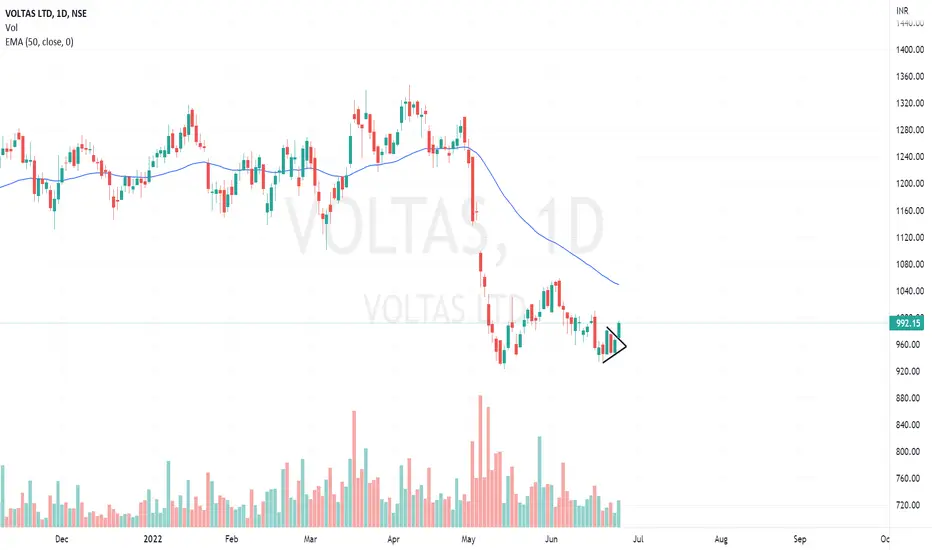
50 EMA retracement in 1 MTF!The Analysis is quite simple!
×The Supports taken by the Trend is key factor in this Trade.
×3 Supports has been taken since DEC 2013.
×Patience is required to Trade these Patterns, definitely not for Intra-Day rather go for Swing-Trades.
Tata Stock!!!

VoltasVoltas CMP 874
some counts on chart
IF its hold 858 levels
I am expecting a decent Bounce in the counter...
some decent return one can expect in it over the period ...
Vedang:)
Chart is for study purpose only!!

VoltasDisclaimer: taking virtual trade
stock broke its support and retested its support
do your own research, then only take positions.

voltas rsi below 35for educational purpose, rsi level below 35 and also if it cross b point start add it slowly

VOLTASVOLTAS - Catching a falling knife. Only high risk traders should enter here
Huge divergence with RSI on daily time frame.
One can go long with a strict SL of 860.

Sell of the week. VoltasVoltas has give breakdown of Head and Shoulders trend reversal pattern on its weekly charts. One can short this stock as the risk reward ratio is super favorable.
CMP - 900
T - 830, 730, 550 W
Sl - 931 W
View - Short to medium term.


Voltas LimitedVoltas Limited all levels given in chart clearly please trade based on ur own analysis with risk and rewars.....do your own research before trade...target are based on FIBO.
Channel pattern with proper support line.Voltas creating a channel pattern with hitting the same support line many times hoping for a big move in upcoming days.

Short term best stock in consumption sector Best stock for short term target this stock will be fire buy only above or equal to 1008- 1010

VOLTASVoltas is near the support level. RSI showing positive divergence . I think it is in the 4th wave. Hence can be a slow stock.

Voltas BuyThe stock looks good for long.
Buy Buy.
Disclaimer: Don't just blindly Trade or Invest, learn and then trade. Manage your risks properly.
This analysis is purely for EDUCATIONAL purpose

VOLTAS LONGVOLTAS LONG
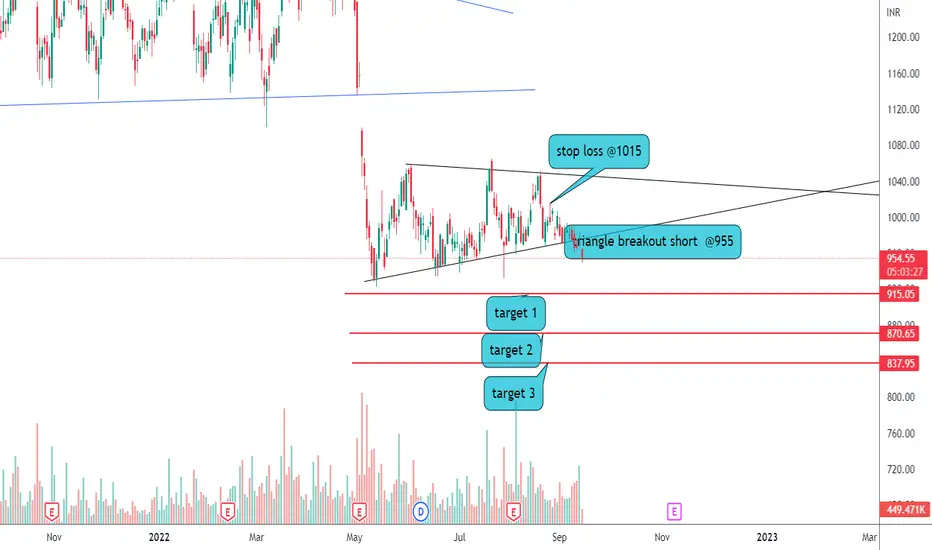
Breaking out of the downward triangle
Expecting around 15% move in short term.
No recommendations, Just a view.

voltasVoltas broke out of triangle pattern & trading above it comfortably on bigger timeframes with decent volumes.
Buy with mentioned stoploss & targets.
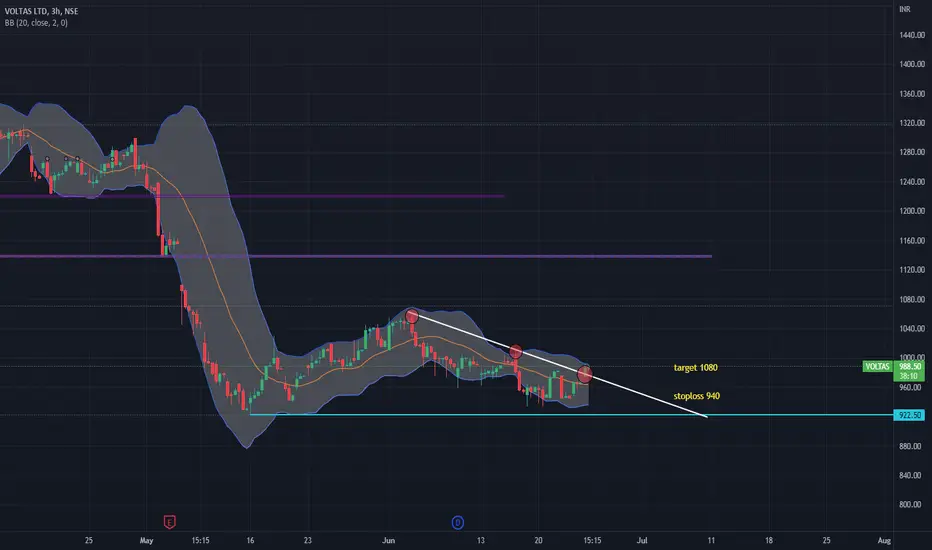
VOLTAS VOLTAS - Pennant breakout
This is a swing trade set up.
Targets - 1020 / 1040
SL - 960
Not how the stock has refused to give a break down below 920 levels and all the supply is being absorbed in the current range.
We have a structural breakout here.
Voltas stage analysisStage analysis of Voltas limited. This is in currently Stage 4 and company is getting tough competition in Indian market.


Voltas Cup and Handle in 30 mins?Voltas had formed a cup and handle pattern, wait for the trendline breakout for further upmove. Already given breakout with volumes in the past sessions.

