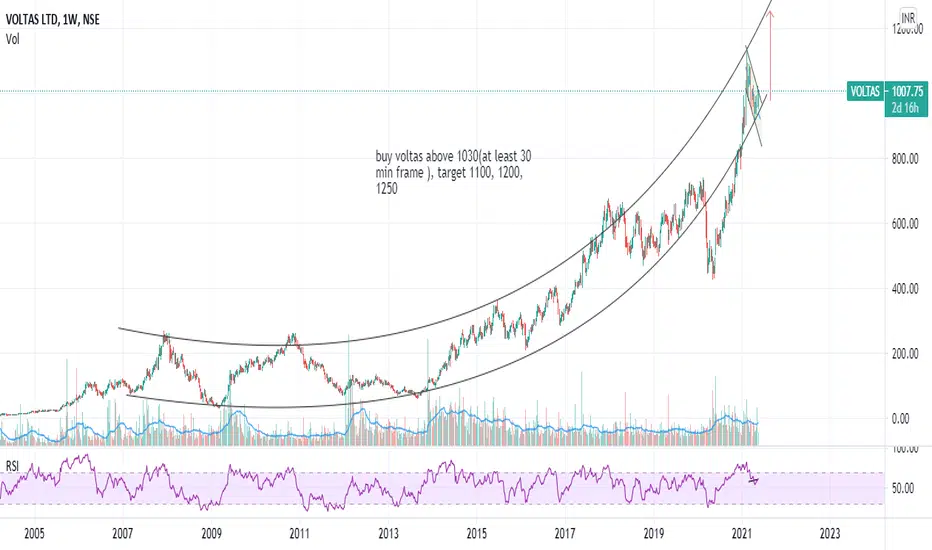
Voltas || LongLooking bullish now. I think it is good to enter now with a SL of 934 level but recommended SL is 1016... Target is 1139
VOLTAS trade ideas

VOLTAS LONG INTRADAY 18 JUN,2021Dear trader,
If u look at the chart of VOLTAS (analysis based intraday only) the VOLTAS Buy at 1030 and Target at 1045
Best Buy at 1025.
Our Best Buy is based on high quality research and when the instrument reaches this level , it’s a jackpot trade.
Best Buy level might be executed or might not be executed.
The chart clearly indicates Bullish Trend you can also see the candle stick patters for more indepth analysis.
In Intraday most important thing is to enter and exit points.
Our signals are based on analytics, algorithms, mathematical derivatives.
Always be a responsible trader, kindly trade only when you have maximum opportunity in the market with minimum risk and with keynotes like data, analysis and proper strategies.
Kindly message us for strategies and analysis.


VOLTAS BREAKOUTVOLTAS HAS SHOWN A BREAKOUT FROM TRIANGLE PATTERN AND IS GETTING A RETRACEMENT TO A VERY IMPORTANT SUPPOR IT IS THE BEST TIME TO GO LONG WITH HIGH RISK REWARD SETUP.


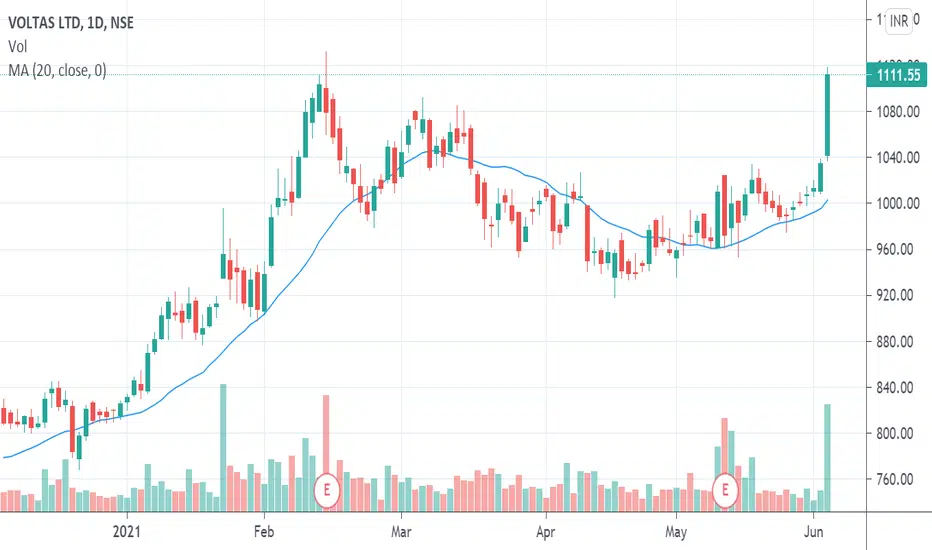
VOLTASThere has been a great upside in voltas today, the volumes have been amazing and it seems ready for further upmove.
Last time when you saw such volumes it gave a great run up from that point, and even the data shows good signs.
With a stop loss of 1095-1100 it can be played for 1140 and if sustains beyond 1140 then 1200 seems evident.
Keep trailing stop loss as script it is quite highly moving.
************************************************************************************************************************************************
Hi all,
Its pleasure to have you all here.
I have started putting these charts as a contribution from my side to all people who are new to business, as I had to struggle a lot without any sources at disposal. So please consider this a just small contribution from my side.
Few Honest Disclosures:
1. Any idea shared is my personal view, its not a recommendation, neither any kind of paid propaganda, so please
do your bit of research.
2. Ideas shared does not mean that I trade all or have position in them, this is just a helping hand to all.
3. I expect no comments or like nor any negativity, as I said its just a small helping hand from my side, please plan your risk and trade as per your capacity.
4. To trade in Cash, options or futures is your sole choice and your own risk
5. I am no expert in Tech Indicators, I believe in support resistance and trendline theory, you may use this as a supplement theory for better results.
6. I work for my own living, this is a hobby which I do sincerely to help anyone who might come across my charts.
***********************************************************************************************************************************************


VOLTAS LONGAFTER MASSIVE BUYING MOVE . GIVEN BREAK OUT + RETEST FROM FALLING WEDGE . CAN BE A GOOD BUY FOR 1-3 MONTHS NEGATIONS ALREADY IN CHART.


VOTAS ::: HIGH RISK BULLISH TRADEH I G H R I S K T R A D E
DATE: 09 MAY 2021
INSTRUMENT: VOLTAS LTD
TREND: BUY
TIME FRAME: DAY
CMP: 969.60
BUY ABOVE: 993 - 1000
STOP LOSS: 954
TGT 01: 1047
DISCLAIMER:
We are not S E B I registered analysts. Please consult your personal financial advisor before investing. We are not responsible for your profits/losses whatsoever.


VOLTAS Looking Bullish now and Heavily Bullish above 1122
All the key levels are mentioned in chart with Stop-loss and Targets
Disclaimer
I am not sebi registered analyst
My studies are Educational purpose only
Please consult with your Financial advisor before trading or investing