Wipro forming bearish GartleyWipro forming bearish Gartley and prz is at hidden base which is aligned with left shoulder, in RTM terms we call it LS kink , Also known as Quasimodo/QM , Remember only short when we get a swap in atleast 5 min timeframe,
WIPRO trade ideas


wipro breakdowan trendlinewipro breakdowan trendline
short wipro
Please consult your financial advisor before investing.
All research for educational purposes only

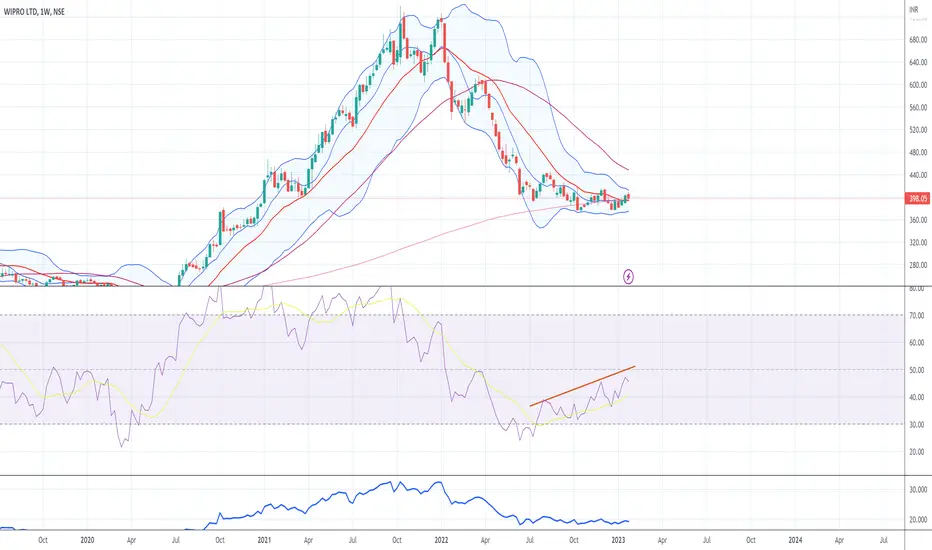
WIPROWIPRO - Momentum buildup at reversal point.
Point D is regarded as a very strong reversal point & watch how the stock has accumulated near the same point.
Risky players can add here, with a SL as recent swing low.

Wipro Long time investment Opportunity Wipro Long time investment Opportunity. Retesting the multiyear breakout level and also forming rounding bottom pattern. Looks good opportunity for long term investment.

wipro w pattern in weekly time frameW pattern in weekly chart. By the way, this stock is fundamentally strong in my view so, didn't sold even I have a bought near 450 to 500 rupees. After consolidation again wipro is ready to move up with good pattern.
Please consult your financial advisor before investing.
All Research for educational purposes only

wipro buy long tream holding entry=402 SL=370 TARGET=1200WIPRO LONG TREAM holding buy 402 sl 370 tp 1200 bullish harmonic patterns

W pattern in weekly chart Wipeout stock made W pattern in weekly chart. By the way, this stock is fundamentally strong in my view so, didn't sold even I have a bought near 550 rupees. After consolidation again wipro is ready to move up with good pattern.

WIPRO A weekly timeframe chart of WIPRO which is losing from the last year
Strong support zone is 370
Minor resistance zone is 420 zone

RSI Divergence in Wipro You can see that the stock has made a higher-high but the RSI has made a lower high
Further, the stock also has broken a trend line, thus the trend has been broken
To support this analysis the stock has crossed its 20-MA.
My target would be around 386-388
and 2:1 reward risk ratio

#WIPROStock has strong support @ 380 levels and now all IT stocks has started to move after a long down trend view US NASDAQ positive, accumulate for longer run.


Wipro at 5th wave.. bulish....in short term.Stop loss at break 2-4 trend line....
Target 🎯 will be ...1: 2 ratio.....

Wipro - ready for bounce
wipro - at 200 EMA on weekly chart - ready for bounce; also positive RSI divergence seen
Wipro Bullish in 1 DTF!#The Pattern is a simple Support and Resistance
Points to Look:
1.The Channel Pattern is slanted downwards, this pattern has a high success rate!
2.Inside the pattern the recent trend is Bullish(Higher Lowes formation)
3.There is 'W' shape pull visible(23 Dec to Jan 6 touch points) in the trend which is also a good bullish sign.
4.Despite all this wait for a confirmation candle tomorrow and then take the position.
5.The Stoploss is minimal which can be kept below the upper trend line also shown in chart.
$Happy Trading Mates$

Wipro 4 Hourly Timeframe Wipro in 4 Hour Timeframe formed Twizzer top pattern & bearish engulfing. If next candle formed bearish then pattern will be confirmed i.e bearish engulfing and you can set 1:1 target.

wipro long for deliveryThere is a fib level of 60% which has held the stock.
There is a monthly positive divergence here.
daily 200 ma is holding the price nicely.
I feel it should be bought here for a long term.
The weekly 2oo ma is close at 410 which might hold the stock into sideways trend.
The trendline that i have drawn might be wrong, please give your suggestions.

$WIT with a Bullish outlook following its earnings #Stocks The PEAD projected a Bullish outlook for $WIT after a Negative over reaction following its earnings release placing the stock in drift C with an expected accuracy of 100%.

WIPRONSE:WIPRO
Good Earnings !
All Indicators look Positive , Much Needed BO !
One can Go Long !
Note :
1.One Can Go long with a Strict SL below the Trendline or Swing Low of Daily Candle.
2. Close, should be good and Clean.
3. R:R ratio should be 1 :2 minimum
4. Plan as per your RISK appetite
Disclaimer : You are responsible for your Profits and loss, Shared for Educational purpose!

Wipro Looks good for Swing/IntradayWipro has given a breakout of a small pattern from cmp we can aim for small target or even higher levels too.

Symmetrical TriangleWipro is on low looking good buy around breaking above the triangle pattern, expecting target given on the chart with below level as stop loss.
Lets see..

BUY WIPRO From this levelthis is also one of the GEM from entire indian stocks this stock has made kharabpati to their investor who ever had invested since inception...anyway that was all history let's focus now,, at current level wipro looking jhakkas so i am going to take some position in it. i will suggest to buy for longer term don't think any trading idea's in it as this is one of behatreen share from entire indian stock so buy and hold for long term...
Disclaimer:= I have this stock in my portfolio,
Please like and follow me on tradingview
Thankyou

