WIPRO - Buy at support - Sell at resistanceChart is self explanatory.
Don't invest or trade blindly.
WIPRO trade ideas

Unique Idea and View 2024 MultibaggerMy unique Idea Of 3 Time Frame 1m,1w,1d And Conformation With 3 Indicator. Just Follow the Purple Path Line…
Recomondate: First Paper Trade Then Learn. #3tx3i

Wipro -Possible set up If the support zone makes the green bullish candle , it can up to the trendline resistance
Once the trendline resistance breaks , it will have a rally 21% up.

WIPRO AS Expected 🥳👌🙏👍🏻Just really moving on the trend line
Draw a week ago 🥳👌👌
Follow for other interested charts.


Wipro for long termWipro we can hold long term, it is an Excellent opportunity to enter now, The stock is moving from bearing to bulling in coming weeks, you can keep stop loss below 374, My advice is to keep it for long term without stop loss, first and second target looks decent, The IT stock is breaking out of the Long consolidation phase so this is an excellent time to take risk.
first target 444
second target 619

WIPRO Break OutWipro has simultaneously given BO above falling trendline and 50 dema. RSI supporting the same.
Closing above 420 will activate initial targets of 470 and 490. Unlike its peers (TCS, INFY), sharp rally is yet to come.
Keep strict SL: Closing below 370

Wipro broke falling wedge on daily TF also RSI above 60+ on dailWipro broke falling wedge on daily TF also RSI above 60+ on daily weekly
taken support from 60 level its good time to get in

Wipro long Weekly breakout in wipro target 425... already nifty IT showing strength..and giving breakout


WIPROday chart of wipro in which this stocks make bottom or strong support zone at 372 and next strong resistance zone is 446

LONG ::: WIPRODATE: 23 NOV 2022
INSTRUMENT: WIPRO
CMP: 388.75
BUY ABOVE: 389.70
SL: 384.45
EXIT 01: 395.10
EXIT 02: 401.40
RISK DISCLOSURE:
We are not SEBI registered analyst.
views expressed here are for our record purposes only.
Please consult your personal financial advisor before investing.
We are not responsible for your profits / losses what so ever.

Wipro move upto 7%Buy Range:396-398
Stoploss:383
Target:425
Move: upto 6.5%-7%
Duration: In 20-25 days
This large-cap IT stock has been consolidating for a couple of weeks within the technical price pattern of a symmetrical triangle. The price is seen attempting to break out from this pattern. This can trigger a potential up-move in the stock by close to 6.7%. This price set-up makes it attractive to buy at the current level with a favourable risk-reward ratio.After forming a bottom at Rs 378-Rs 380 levels in October, the stock price of Wipro Ltd (WIPRO) formed a higher bottom, which hinted at initial signs of reversal in the trend. While forming a higher bottom, the stock price moved above the 50-day MA, indicating bullishness in the near term. The recent attempt to break out from the pattern is accompanied by an increase in volumes. They have stayed higher than their 20-day average. This raises the possibility of a sustainable up-move taking place over the coming days. The Relative Strength Index (RSI), which is the lead indicator, had made a break out from the downward-sloping trend line resistance, which can have potentially bullish implications. The MACD has crossed above the signal line as well as moved up in the positive territory. This indicates that the upside momentum is increasing. The Parabolic SAR is an indicator that is used to identify points of potential stops and reversal of trends. This signal at present remains in a continuing buy mode, indicating the current trend to be on the upside.
Thus, an attempt to break out from the current price pattern, the RSI breaking out from the downward-sloping trend line resistance and the PSAR staying in a continuing buy mode lays the ground for a potential up-move by close to 6.7%. Any move below Rs 383 can be considered to move out of the stock.

WIPRO BREAKOUTWipro is breaking out from triangle pattern. If retest we may see an uptrend soon . Study before invest

WIPRO BREAKING TREND LINEWipro has given a breakout from its channel, Not very attractive volumes to consider a breakout yet.

Wipro falling wedge patternWipro made falling wedge pattern on D &W TF
And breakout came IT sector was also making a " W " pattern

WIPROWipro Technically Looking Weak
Closed Below 400 Today, Bearish Cross Over Of Ema 10 , 21 , 63 , 100 , 200
Observed Head And Shoulder Pattern In Daily Chart
Expected To Reach The Mentioned Down Ward Targets In Coming Days - For Decisive Up Move It Has To Close Above 63 Day Ema On Dcb
It Company - With Good Valuation After Hcl Tech
Long-Term Growth Is Intact

Wipro Falling bridge Wait For Entry Candle 🕯️ buy entry @406
Maintain Stoploss @Gagandeep11902
Target - (440-50)
2nd target - (490-500)

Wipro Hey traders this a wipro daily chart an IT sector company which is falling rapidly from last year now it making falling wedge pattern which is bullish 370 zone will be striong support zone

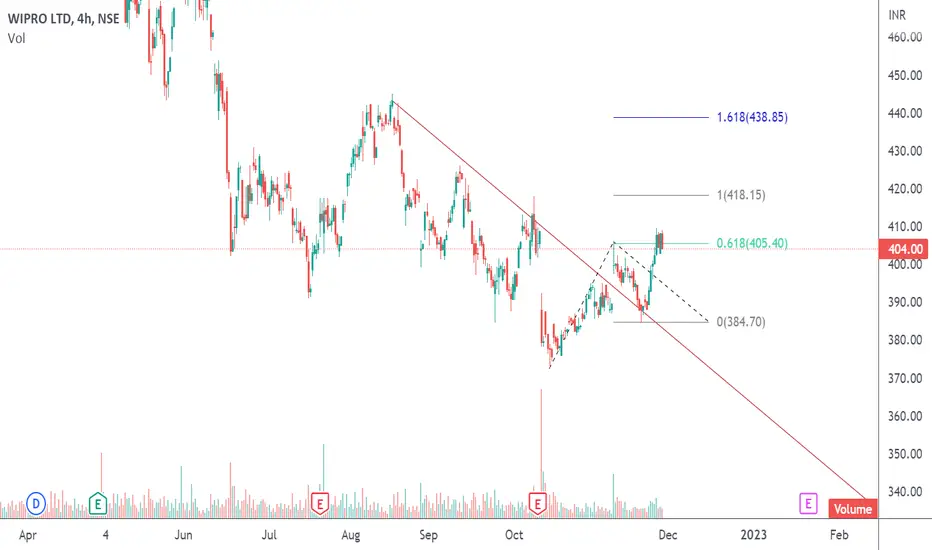
WIPRO LTD 60% RetracementNSE:WIPRO has retraced 60% from its top. As per analysis, this is the best time to make entry for long position.
My entry point is 380. Will wait for target of 449 & 515
Stop loss will be only 30 points (350)
Note: This is my personal analysis, only for learning.
Thanks.

Wipro short term callWipro for target price above 420. Share is recovering from bottom and now we will see higher high and higher low formation

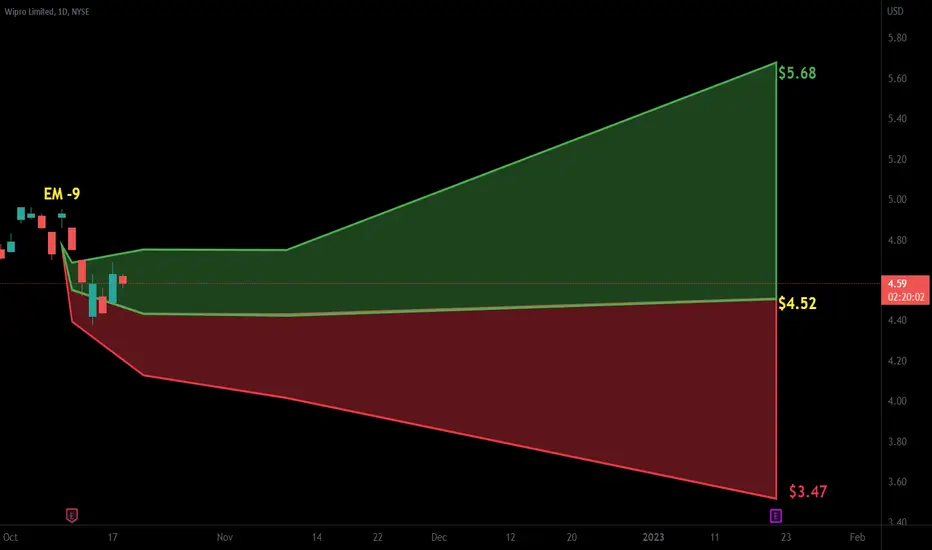
$WIT with a Bearish outlook following its earnings #Stocks The PEAD projected a Bearish outlook for $WIT after a Negative Under reaction following its earnings release placing the stock in drift D with an expected accuracy of 66.67%.