WiproWIPRO
Currently Trading -364.20
Target 1-370.70
Target 2-377.55
Target 3-389.30
Reason
Macd cross over the signal line towards upward movement.
Short term investment Target
WIPRO trade ideas

WiproWipro
Currently Trading-364.20
Target 1-370.70
Target 2-377.55
Target 3-389.30
Reason-
1.Macd cross over the singnal line towards upward movement.


WIPRO - NO FRESH ENTRYWIPRO is not giving any fresh opportunity on daily basis. However, once it kissed 346 can add some quantity.

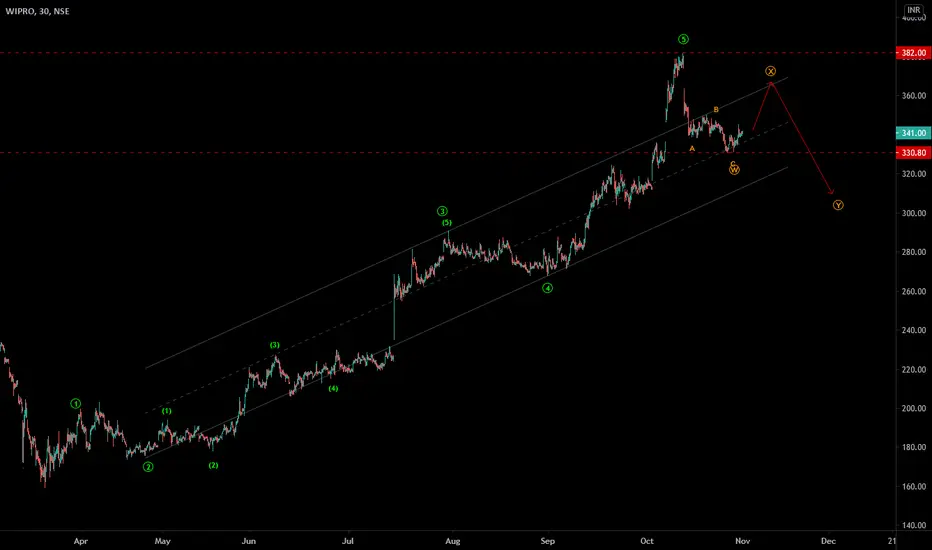
Wipro - Elliott wave analysis - WXY correction Wipro is in corrective mode after impulse cycle finished at the last top. Price is expected to go down in Y wave for target below 320. The X wave is completed yet, so wait for confirmation of short trade.

Wipro - Intraday / Swing Trade SetupWipro CMP - 358.90
Looking bullish in higher time frame. One can go for Intraday / Swing Trade setup with the following entry, exit & targets
Buy at or Above 361 / Stop Loss - 356
Target 1 - 364
Target 2 - 367
Target 3 - 370 / 375
Disclaimer: This is my view and for educational purpose only.


WIPROI'm not an expert I'm just sharing my views on WIPRO for next trading day
I'm not responsible for any profit or loss this is not a recommendation.
WIPRO - Darvas Box Breakout & Retesting - short term swingThis analysis is purely based on price action and Chart Patterns.
Through this analysis, a special strategy of how to trade DARVAS BOX is explained.
For similar case, one can refer the 15 minute chart of HEROMOTOCO from 03-Nov to 11-Nov. Similar Darvas Box breakout worked there.
The analysis is on 30min TF hence target can be achieved in intraday trade or in couple of days
Trade strategy is explained in image itself. Don't chase the price.
Always plan your trade & trade your plan
Keep trailing SL accordingly once entered into the trade.
Trade at your own risk and money management. Do your own study before taking any trade
Feel free to comment for any queries & suggestion

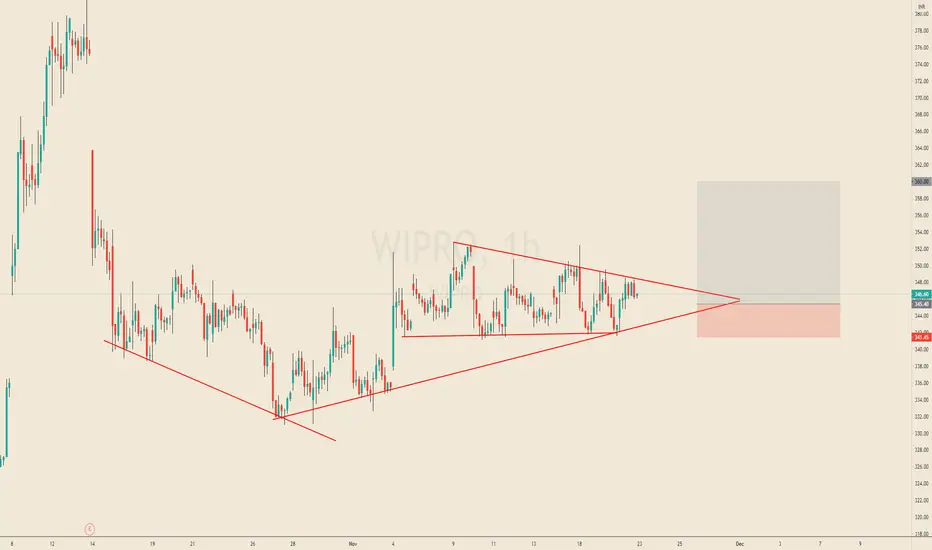
Wipro Wipro is consolidating from 15 Oct, can wait for either of mentioned levels (green line) to break to take entry


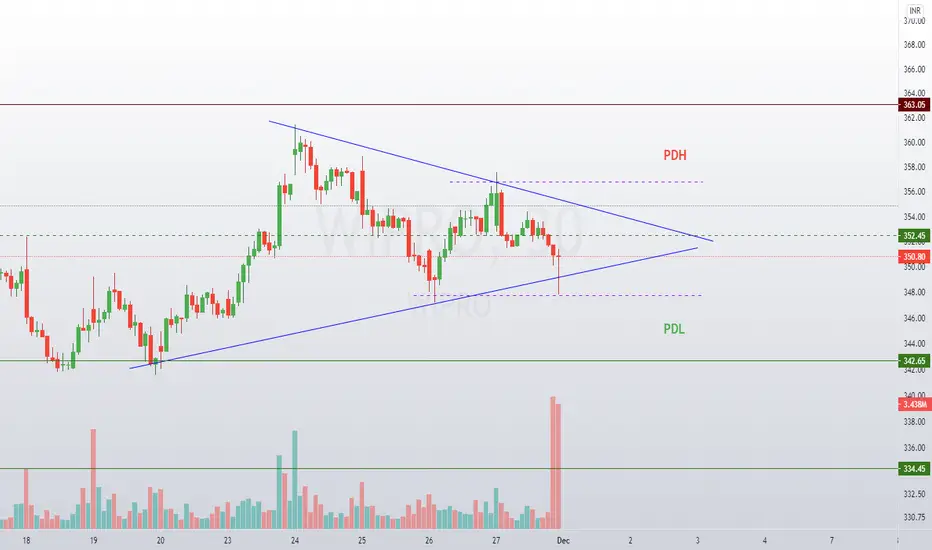
Simple triangle patternThe price moved high the gap down-filled and made a simple triangle pattern, which may result in a breakout. long side


WIPRO - Elliott wave analysis WIPRO - It has completed impulse up wave from major bottom. So expecting correction down. It is in X wave up, once it gets finished, sell for Y down.
Give thumbs up if you really like the trade idea.