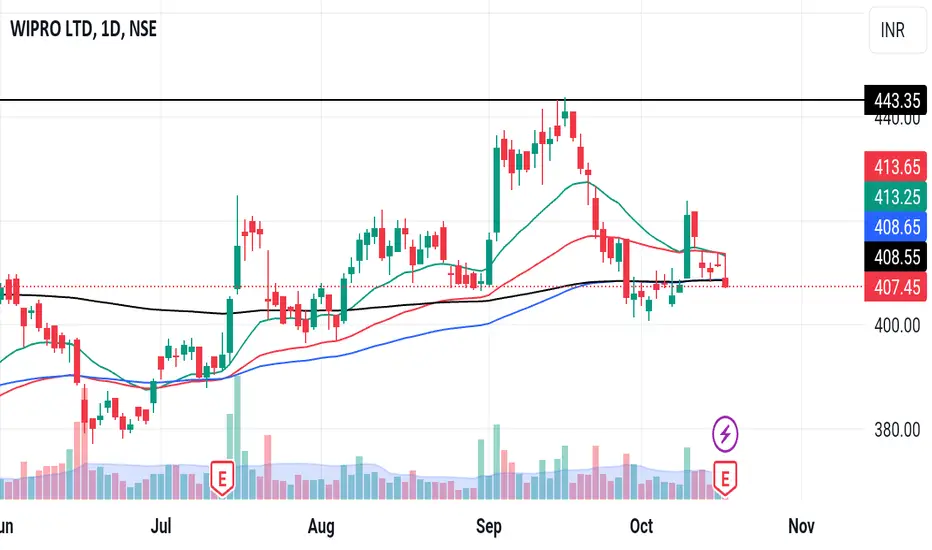
WIPRO LOOKS GOOD FOR SWINGWIPRO looks good for swing, its sitting at a support trendline there it has made a bullish candle too. we can take a trade from cmp and we can aim till supply zone area as a target.
leave a comment for this setup.
I daily post breakout stocks analysis follow me for more.
Thank you.
WIPRO trade ideas

WIPRO SHORTStock in sideways
Spinning top on charts
Result not good.
Wipro adr fell -2%
Price break 200 DEMA
Disclaimer This is my personal view for education purpose only.
No Buy sell recommendations

Sell call in Wipro There is sell side call in Wipro. Stock is trading below 50 EMA moving averages. Sell wipro for short term Target.

WIPRO long idea 414can buy near 414 and keep sl on close below 394 . a decent risk reward ratio of trade works out, slow mover stock so tons of patience required, if works then even 10:1 reward isnt ruled out

Getting ready for new Trend.
There is an inverted head and shoulder pattern, which indicate that stock has created a bottom. And getting ready for a new trend. When this type of pattern forms in the bottom its a strong indication of stock reversal.

Wipro setupBuy On level
Support-410.50
Target1-458
Weekly ema 50 support
strong base made
Educational Purpose idea

Wipro long setup Wipro can reverse from 380
important level
Educational purposes only do your own research

WIPROThese are swing idea's which you can add your watchlist and analysis for yourself.
Keep on radar.
Potential upside stock!
This content for only education purpose!
I am not SEBI Register.

Wipro headed back up...Wipro completed its retracement and can bought for every dip......Targets are pointed out.....Keep risk management in mind and don't invest more than 10% of your capital in a single stock....

WiproWipro CMP 435
Consolidation for our a year in this zone
If we break out of 430/440 zone 600++ targets can be seen
Buy above 445
SL 370
Targets 600++
Short Term/Positional

ROUNDING BOTTOM PATTERNVery Beautiful Accumulation pattern visible on Wipro chart.
Also rounding bottom pattern.
Buy @433 add Above 445
SL weekly close below 397
T1-445
T2-552
T3-608

Goldencross Strategy PT-7:A value play in IT *Goldencross strategy is one of the efficient strategy in long-term investing*
Follow the FIVE rules below.👇
1) Book 50% of profit at TP-1.
2)Book whole profit at TP-2 or wait for deathcross and Book whole profit when happened.
3) Stoploss is when deathcross happened,be patient in volatile situations.
4) Wait as long as it hits TP as it is sluggish but strong bullish strategy.
5)Keep your capital allocation based on your RISK.
**CHART IS SELF EXPLANATORY*
Disclaimer: This is not a financial advice based on your POV.Everyone has distinct financial objectives and time horizon.

Wipro (Investment Ideas):Wipro (Investment Ideas):
A fine base has been built on the lower side.
Time to invest in this large cap from investment perspective.
One can expect a minimum 75% gains via swing.
Go long while script rovers around 400-430.
Appropriate resistances/targets are highlighted.
Note: Do your own due diligence before taking any action.
I would be posting updates for this chart in the comments sections as time progresses.
Feel free to raise your queries.

WIPRO--@Resistance??The stock is currently hovering close to its resistance zone, while a distinct demand zone is evident around the 400-level mark. Furthermore, there is confirmation from the trendline.
For a prudent trading approach, it is advisable to refrain from entering a short position until two conditions are met: first, a clear breach of the Demand zone, and second, a confirmation of the trendline breach. Until these two criteria are satisfied, it's more favorable to maintain a bullish stance and continue with buy-side strategies.

Wiproenter positionally with 100.. keep adding as suggested. Long term target 4 digits. Investment grade stock so swing/intra to be avoided.

WIPRO: PICK OF THE YEARWipro Looks Great with Technical Analysis!
There are a lot of hidden reasons for selecting Wipro as the Pick of the Year.
Let me show you:
First, Wipro and Nifty Ratio Chart
This is a hidden Information, and see how chart is taking support
Secondly, Wipro and NiftyIT Ratio Chart
Again a hidden information and See how Wipro is taking support in this also
Both of Above information suggesting a good support after a long time in Wipro
And this support can give you the best investment price.
Third, watch how Wipro is taking support on Monthly chart
It was a resistance trendline where Wipro gave a breakout few years back and now it is retesting those levels, and is consolidating. This can be a good Demand Zone and we can expect a price reversal
Also, if you notice the previous Wipro High, It is giving Wipro a Horizontal Support.
And the best part is, the level is 0.618 Fibonacci Zone, that too in a Monthly Chart.
Fourth, Fundamentals are still great with Profits increasing every year.
FIIs and DIIs have increased there stakes in the company last quarter, so this information can be a highlight for us to invest in WIPRO.
With all these analysis, I think Wipro can be a very good reversal stock for next few months, and we can see a good up move in Wipro.
This all reasons make me pick WIPRO as the PICK OF THE YEAR.
What do you think about this idea?

WIPRO Weekly TimeframeWipro on a Weekly ti,eframe has formed an inverted H&S pattern an uis hovering at resistance since 4 weeks. High proability trade upside. Must watchput IT sector for upcoming weeks.

Wipro - Breakout from key level Wipro chart show’s breakout from key level after consolidated over a resistance ,also 50/200 crossover happened. Looks good for long term.

WIPRONSE:WIPRO
One Can Enter Now !
Or Wait for Retest of the Trendline (BO) !
Or wait For better R:R ratio !
Note :
1.One Can Go long with a Strict SL below the Trendline or Swing Low.
2. R:R ratio should be 1 :2 minimum
3. Plan as per your RISK appetite and Money Management.
Disclaimer : You are responsible for your Profits and loss, Shared for Educational purpose

It's time for breakoutBroke the last one year range of 420 to 423
If it closes above 424 on weekly closing.
It will be fireworks in IT stocks.

Swing Buy Opportunity in WiproEntry: 416
Target: 408
SL: 424
NOTE: This trade is only for Equity Swing buy and not to be considered for options trading.
Please do follow Position Sizing and Risk Reward Ratio while planning any trades.
Note: This information is for education purpose only and please do your own research and consult your financial advisor prior to taking any action.
TO CONNECT WITH ME CHECK OUT MY BIO.
If you like this Idea, Please do like my ideas and share it with your friends. check my bio.
Please boost my ideas and send cheers as it acts as a motivation to keep posting my analysis.
Thank you

