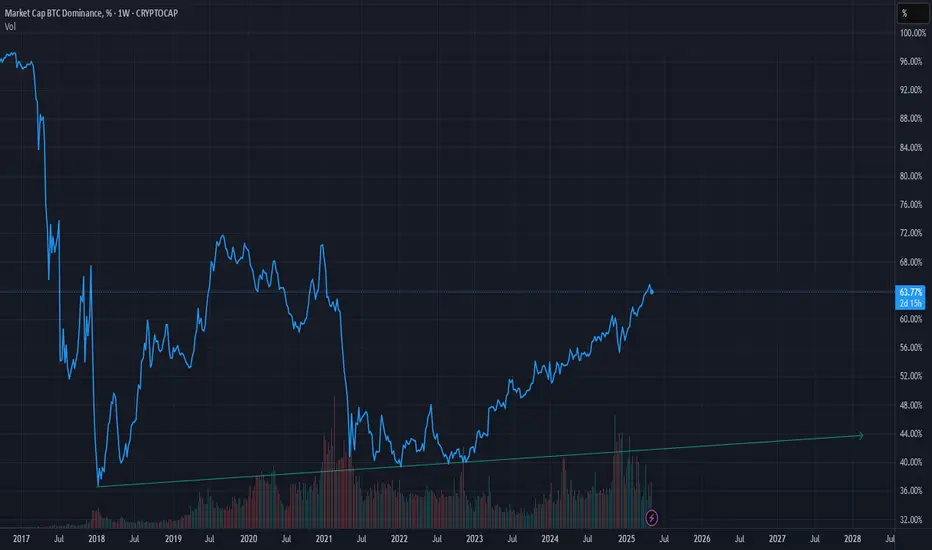
Bitcoin Dominance TA, Bearish SignalsRecently I spotted a very strong, long-term bearish signal on this index. A triple-bearish signal as it is present with three indicators. I am talking about a bearish divergence.
Volume has been dropping significantly as the index moves higher.
The weekly RSI peaked October 2023 and has been producing lower highs. The MACD peaked July 2023.
These are long-term, but let's have a closer look and consider the daily chart.
Here we have some interesting signals as well, let's start with the candles:
—Here we have a rising wedge ending in a rounded top and long-term double-top. The uptrend is also in risk of failing. A breakdown of this uptrend, which can happen anytime, would result in a strong crash of this index.
Next is the daily RSI:
—The peak happened November 2024. There is also a short-term lower high as the peak this month happened on the 7th of April, the index peaked on the 22nd.
—The daily RSI is already trending lower.
Clearly the most interesting and revealing of all three indicators is the daily MACD. Let me show you the chart first and then I'll describe the signals:
—Here the lower high is so strong that reveals what is coming to this index. The MACD peaked in February and produced a lower high this month, April. Notice the bearish cross, it happened yesterday.
The daily MACD and RSI trending down with short-term, mid-term, long-term and long long-term bearish divergence all point towards a lower reading on these oscillators.
The last major drop for this index happened in November 2024 with the bottom hitting a month later, December 2024. At this time Bitcoin produced a very strong advance as well as the entire Altcoins market, it was awesome.
It is surely interesting to notice that the index recovers and moves higher while Bitcoin continued to grow. But at that time the Altcoins were starting their correction. Most of the Altcoins peaked late November 2024 and some in early December 2024. So this index is more related to how the Altcoins behave rather than Bitcoin.
When it drops, it does not mean that Bitcoin will drop but that the Altcoins will grow. When it grows, it does not necessarily means that Bitcoin is moving up but that the Altcoins are moving down.
We know the Altcoins are set to produce their strongest growth period since 2021. This Bitcoin Dominance index works as confirmation. It leaves no room for doubt.
» Doubt can remain open as to whether the start of this rise will happen tomorrow or within a few weeks. Short-term, anything goes; the market can become erratic and produce some strong shakeouts, specially preceding a major wave of growth. But after 2-3 weeks, it is 1,000% certain that the entire Cryptocurrency market will be bullish and up. Regardless of what this index does or anything else for that matter. When the time is ripe, the market grows.
The time is ripe right now... You will be happy with the results.
Namaste.
BTC.D trade ideas

ALL WHAT YOU NEED IN CRYPTO MARKET IN ONE analysis HERE Bitcoin Dominance: The Approaching Cycle Peak and Major Correction Signal
The Bitcoin dominance chart from May 10, 2025, reveals a fascinating technical formation that forecasts a significant market shift in the coming months. Currently at 63.39%, BTC dominance has reached a critical inflection point that demands investor attention.
Pattern Analysis: Terminal Extension Phase
The weekly chart shows Bitcoin dominance has formed a clear ascending channel (yellow boundaries) since the 2022 bottom. What's particularly noteworthy is how price action has reached the confluence of two major resistance zones:
1. The long-term descending resistance (white diagonal) dating back to 2021's 73.63% peak
2. The upper boundary of the current ascending channel
This dual resistance intersection creates what technical analysts call a "Terminal Extension Pattern" - typically the final phase before significant trend reversal.
Distribution Structure Forming
The two horizontal red zones represent likely distribution ranges where institutional investors may begin rotating capital from Bitcoin into altcoins. These distribution zones are strategically positioned at:
- Primary zone: 62-65% (current trading range)
- Secondary zone: 55-58% (first major support)
Projected Correction Pathway
The blue arrows map the anticipated dominance decline:
1. Initial rejection from current levels (63-65%)
2. Corrective bounce at first support (55-58%)
3. Secondary decline toward 50% psychological level
4. Final capitulation toward 38.84% over 6-12 months
Market Implication: "The Great Rotation"
This technical setup suggests the cryptocurrency market is preparing for a significant capital redistribution from Bitcoin toward alternative cryptocurrencies. The declining volume (-0.40%) despite upward price movement (+0.03%) indicates diminishing momentum, a classic divergence preceding major reversals.
The implications are substantial for portfolio strategy - while Bitcoin may continue appreciating in USD terms, altcoins may outperform substantially on a relative basis through 2026, creating exceptional opportunities for portfolio rebalancing.
Investors should monitor the 65.38% level closely as the final resistance before confirmation of this multi-year reversal pattern.
OTHERS.D chart analysis here
and for ETH-BTC analysis here
and for ETH.D analysis here
HELP US WITH LIKE AND FOLLOW GUYS .. THANK YOU

btc DBTC DOMINANCE UPDATE
I think it will rebound from Fibonacci 4.23 in the coming weeks and will be positive for the currencies. Wait for the bullish rockets.

DECEMBER PUMP REPEAT?1-The Btc.d has fallen super greaty. it was suppose to fall from the OB it is staying on due to this, when market went more high it actually helped increase seller movement.
2-The weekly rsi, Daily Smc and Rsi, all together suggest a massive drop close to 60%.
3-The weekly last low will not break, it can be swept but not break. In this condition after massive drop a massive high of Btc.d will occur.
4-If market actually close below weekly high and new week candle didnt close bullish or swept the previous weekly high. the Alts Will Pump crazily.
5-The Alternative Of this means Bullish for BTC.D and Bearish for Alts.
6-Be Alert in news, if massive rally comes due to news book least 70% because market is gonna crash harder.
7-Trade carefully,with patience and earn well.
Hope We all Get Good Profits.

BTC.D breaking key trendlineDominance fell below the trendline it was maintaning since November 2024 and it appears it's being rejected by it.
Remember that RSIs and other indicators don't work that well on dominance and even less in fomo phases.
Good luck

BTC Dominance Rejected Perfectly at 65.48%CRYPTOCAP:BTC.D
Hi everyone,
In my previous idea, I highlighted the 65.48% level as a key resistance — and today, we’ve seen a sharp and clean rejection right from that zone. The reaction aligns perfectly with the levels and path I mapped out earlier, reinforcing the idea that BTC Dominance may be topping out.
This update confirms the original thesis. No need to overcomplicate — the plan is in motion, and unless the structure changes significantly, the outlook remains the same.
Best regards,
Stealth

BTC.D is about to die , long live Alts !Hello Traders 🐺
Oh I told you, my friend!
I predicted this dump a few months ago...
Now I can only say one thing to my audience:
👉 This is where patience finally pays off!
So my friends, this is the beginning of the end for BTC.D, because as you know — nothing can go up forever!
And yes... the Altcoin Season officially started yesterday 🔥🚀
📊 Let’s look at the data:
We’ve got a huge blow-off top on the BTC.D chart and a strong pump on both ETH.D and ETH itself 👇
📉 ETH Dominance:
📈 ETH Price Action:
💥 My ETH trade setup before the breakout:
Okay my friend, I’ve already shown you the path on the weekly chart, and in my opinion, this is one of those life-changing opportunities to load up on Alts — especially ETH and large caps — because we’ve officially entered Phase 2! 😎📈
If you're still not sure what I mean by Phase 2, check out this idea I posted earlier:
🔗
📉 Let’s zoom into the 4H for a better entry:
As shown above, the price may retest the 64.11% level before another leg down, so make sure to act accordingly!
And as always, remember our golden rule 💎:
🐺 Discipline is rarely enjoyable, but almost always profitable 🐺
🐺 KIU_COIN 🐺

Dominance BTCHere’s something interesting on the 4H chart.
We can clearly see that BTC dominance has broken its bullish structure. A retest around 64.50% is likely, followed by a potential 2.60% drop toward 62.50%.

Bitcoin dominance hasn't turned bearish yet.
The timeframe for review is daily.
Due to the decrease in Bitcoin dominance and the price increase of Bitcoin, altcoins experienced significant growth.
The overall trend on the daily timeframe is still bullish, so don't act based on FOMO. To buy coins in the spot market
, we need to wait for a weakening trend in Bitcoin dominance on the daily timeframe.
With confirmation of a weakening trend on the daily timeframe,
it's possible to buy some coins that are bullish relative to Bitcoin.

BTC Dominance Cliff DivesWe’re seeing one of those rare moments in crypto – Bitcoin is rising, and Bitcoin dominance is falling hard at the same time. That’s like spotting a unicorn renting a beachside apartment on Mars.
This move is largely being led by ETH, which I’ve been screaming was overdue for a breakout. To be fair, I’ve been early on that call... for a while now. But it’s finally happening.
ETH massively outpacing Bitcoin on a move like this is the clearest signal yet that an “alt season,” or something close to it, might be on the table. When ETH leads, the rest often follow. The rising tide lifts all boats – even the dead ones.
The dream scenario for altcoin holders? Bitcoin keeps climbing slowly or goes sideways, giving ETH and the broader altcoin market room to run. Confidence is returning, and for now, the rotation is real.

BTC Dominance at Crucial Support– Altseason Incoming OR Ending? 📊🚀 Bitcoin Dominance at Crucial Support – Altseason Incoming? 🌈💰
If you’re wondering why I’ve been focused on BTC more than altcoins recently, this is exactly why! Dominance plays a critical role in understanding market cycles and timing those explosive alt moves.
📚 Quick Recap:
BTC dominance reflects Bitcoin’s market share versus altcoins.
Historically, altcoin bull runs often begin when BTC dominance tops out and reverses.
The last big altseasons kicked off from the 73% dominance zone—but remember, history doesn’t always repeat, it often rhymes!
🔎 Current Chart Observations:
BTC dominance is currently testing support at 63.41% within an ascending channel.
Resistance sits at 64.25%.
The dominance is flirting with re-entering the channel, but hasn’t confirmed yet.
📈 Probability Outlook:
✅ 62% chance BTC dominance breaks down—bullish for altcoins!
❌ 38% chance dominance holds and moves higher—bearish for altcoins.
If BTC dominance breaks down from this level, it won’t just be a red candle—it’ll be a flashing green light for altcoins! 🚦📈
Mastering these cycles is crucial if you want to position yourself properly ahead of the next big alt moves.
One Love,
The FXPROFESSOR 💙

BITCOIN DOMINANCE TOPPED FINALLY? Bitcoin Dominance Peaked Finally 🚀 🚀
You can see in the image that Bitcoin Dominance is now Breaking its Bullish Structure, and clearly indicating that it's topped and Altseason is ready 40x to 50x gains are coming for you if you are still here surviving all the pain and Blood in past years and months.
Congratulations to you. People will call you lucky but they don't know how much you have suffered.
Let's go back and talk about Btc Dominance
BTC dominance is breaking the bullish structure we just need some candles close below these levels which i have marked.
And on weekly timeframe 3rd tap of RSI Bearish divergence also done.
So many things are coming together.
Let's hope for the best and Good Luck

btcd trendline bottomThe term "BTCD" refers to Bitcoin Dominance – a metric that measures Bitcoin’s market capitalisation as a percentage of the total cryptocurrency market. It gives insight into whether investors are favouring Bitcoin over altcoins.
When we mention a "trendline bottom", we're referring to a key support level on the dominance chart that has historically prevented BTCD from falling further. If BTCD is now touching or bouncing from this trendline, it may indicate a potential reversal or resurgence of Bitcoin dominance.
Why This Matters:
Support Level: If the trendline has acted as a bottom several times in the past, a bounce here could signal renewed strength in Bitcoin compared to altcoins.
Rotation Signal: A BTCD bottom often precedes a capital rotation from altcoins back into Bitcoin, suggesting that BTC may outperform altcoins in the short to mid-term.
Macro Sentiment: A strong BTCD trendline can reflect investor caution – moving into Bitcoin as a "safer" crypto during uncertain times.
BTC.D : READY FOR ALT-SEASONHi Guys, Hope You well
As you can see, the trend is finally breaking and the downtrend is starting again for the growth of the altcoins in the market. I hope you get the best profits from this alt season, which may be the last alt season and the best in this market cycle.
SecondChanceCrypto
⏰ 9/May/26
⛔️DYOR

Bitcoin Dominance: Don't Be So OptimisticHello, Skyrexians!
My previous CRYPTOCAP:BTC.D forecast now is playing out well. I bet for the reaching 65.35% before drop, we have seen 65.5% which is almost the same. Now dominance is dumping, but I warned you it's not the end. Now I will give you small update.
I will not cover higher degree waves, you can check previous articles, let's cover only this Elliott waves cycle. The wave 3 now is finished slightly above the 1.61 Fibonacci level and now is printing wave 4, to make sure that wave 4 is finished we want to see the Awesome Oscillator zero line cross and reaching the target area next to 63.5%. After that I expect wave 5, it's not going to be extended because wave 3 is extended, so, the target is 65.5% again to retest. After that we can wait for bigger correction to 61%.
Best regards,
Ivan Skyrexio
___________________________________________________________
Please, boost this article and subscribe our page if you like analysis!


BTC.DThe way this chart has been I'm not even going to guess lol.
Great to finally see some down pressure, now the key here is to see some follow through.

Bitcoin Dominance BTC.D analysisCurrently, the maximum of BTC.D was 65.38% and the absolute maximum is very close, and then the capital will start flowing into altcoins.
We will have to keep a close eye on where the capital will go: only to highly liquid altcoins, or to a certain industry, or to a narrative, as it was before: “defi”, “memecoin”, and so on...
Do you have any ideas where the capital can go? Write in the comments!
❗️ Also, it is worth noting that such a popular term as "alt-season" lasts less and less, and you have to wait longer and longer for it!
It seems that this time the "alt-season" has every chance to last until the end of 2025, and then... it will be seen. Perhaps the market will gain capital and new powerful players who will set a new vector and new rules by 2028....
But first... we have to live to see it!)
_____________________
Did you like our analysis? Leave a comment, like, and follow to get more

Bitcoin Dominance being rejected at major resistancePlan is simple. If the Bitcoin Dominance getting rejected it will draw down other altcoins as well. Probably leading to an altseason if ETH explodes.

A Table to show you Money Flow when BITCOIN DOMIANCE MOVES
A Simple Rule of Thumb can be followed when BITCOIN DOMINANCE moves up or down and it can save you a fortune if you use it properly.
BTC.D - BTC - ALTS
increase - increase - Decrease
increase - Decrease - Decrease Rapid
increase - Stable - Stable
Decrease - Increase - Increase Rapid
Decrease - Decrease - Decrease / Stable
Decrease - Stable - Increase
Currently we are seeing BTC.D Decreasing and yet the BITCOIN Price in Increasing and ALTS are INCREASING
Tjhis is Great BUT you need to watch BTC.D like a Hawk now because when that changes and begind to rise again, as it will do one day, maybe soon maybe in a month....then the likly hood of ALTS dropping Quickly is high
Bitcoin is now in heavy resistance and pushing through.
Pay attention to how long it can do that
The table above is your Saviour

BtcDominance will not BITCOIN Dominance will not hit 70%, idk why people keep saying this. Maybe 66% tops but as of now the falling wedge it ranges in the last two cycles do not play out with btcd hitting 70%.
We are on the cusp of alt season starting. However with crypto development since last cycle, this season is all about utility not memes. Xrp/ada/hbar/sol and any iso20022 compliant crypto will moon.

BTC Dominance Update… top could be formed. Too could be formed with btc dominance. We could be seeing the beginning of alt season start to unfold.

BTC.D done or not?I like to think that 65% may be the top for BTC.D, but it cannot be ignored that BTC.D has gone to around 72% in the last three cycles. Will it do the same this cycle?
