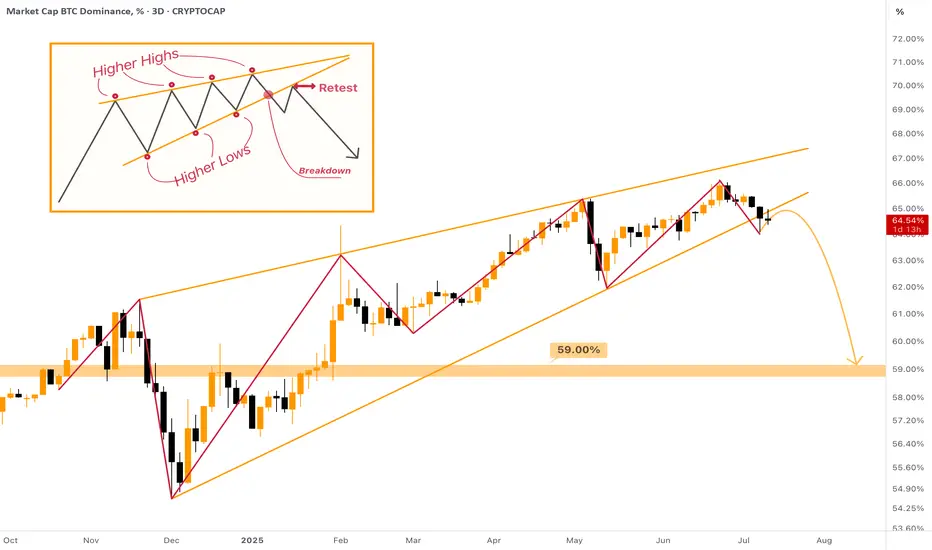
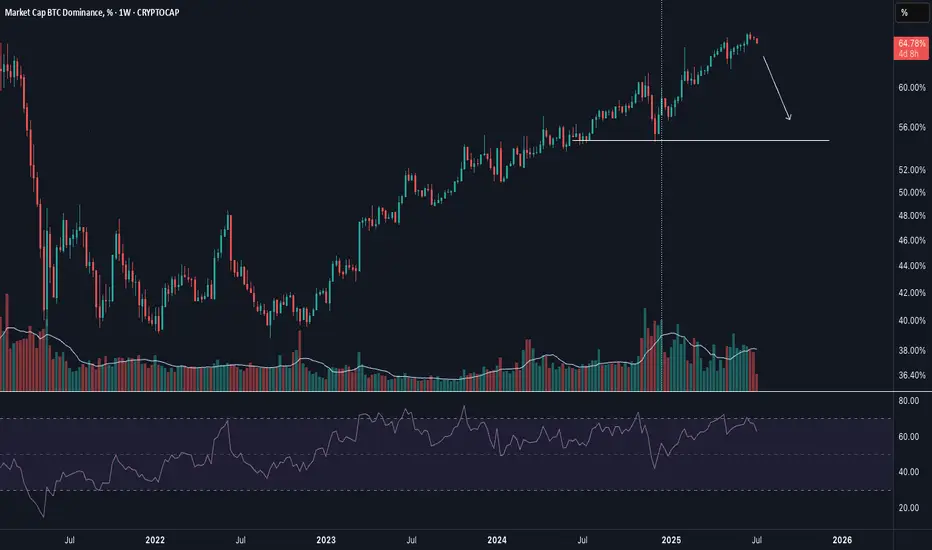
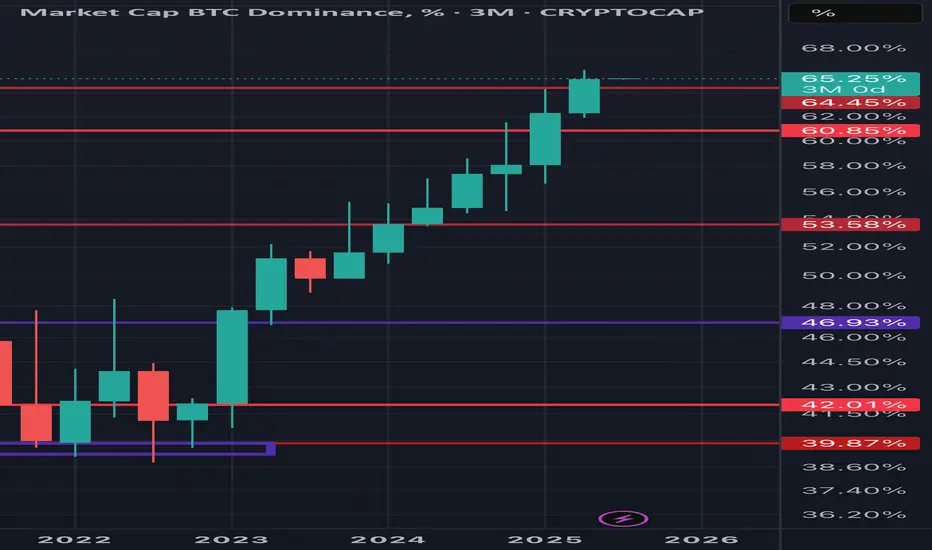
Rising Wedge on Bitcoin Dominance - [BROKEN DOWNWARDS] The MASSIVE Rising Wedge on Bitcoin Dominance was broken downwards during the past week, most likely the 1W candle will also close below the support of the wedge.
What does it mean? The dominance will dump from 64% to at least 59%. This move can already provide us with the huge Altcoin Season! After this there more likely be a small correction towards 60%, and then we can freely dump further towards 54% zone.
I expect not only small cap, but major altcoins to be sent to new highs as well. Mark my words & be prepared for the last opportunity of this bull cycle!
BTC.D trade ideas
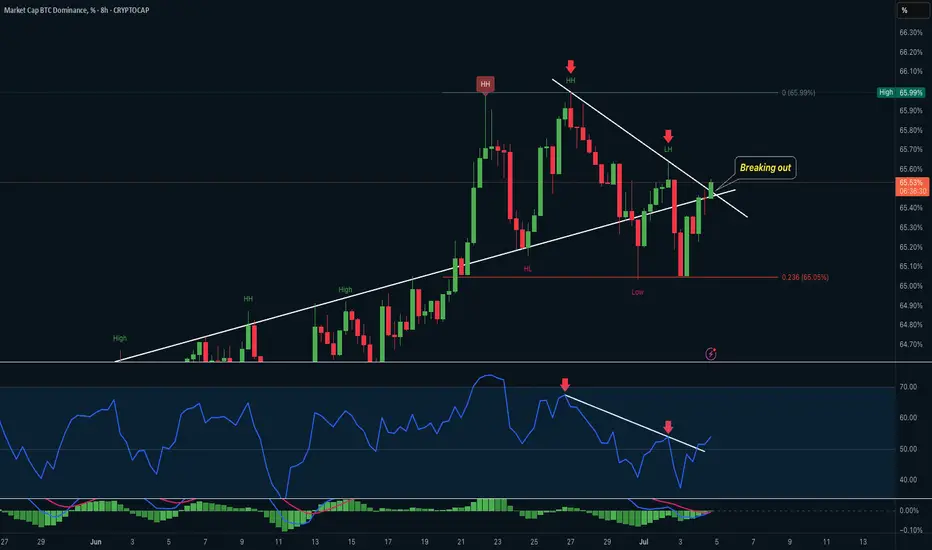
BTC Dominance & RSI – Bullish Breakout with Momentum Divergence RSI Breakout from Downtrend Line (8H)
• RSI broke out from a descending trendline after bouncing from a long-term rising support.
• This indicates a possible momentum reversal, confirming bullish divergence strength.
• The breakout is accompanied by a sharp recovery in RSI value from the 37–40 range.
BTC Dominance Price Action (8H)
• BTC.D has broken out from a descending structure after a double-bottom and trendline retest.
• Price has reclaimed the 65.5% zone, confirming the breakout with strength.
• Structure: HH → HL → Breakout = bullish continuation likely.
• Key support remains at 65.05% (0.236 Fib), while a move above 65.66%–65.79% (Fib confluence zone) will confirm further upside.
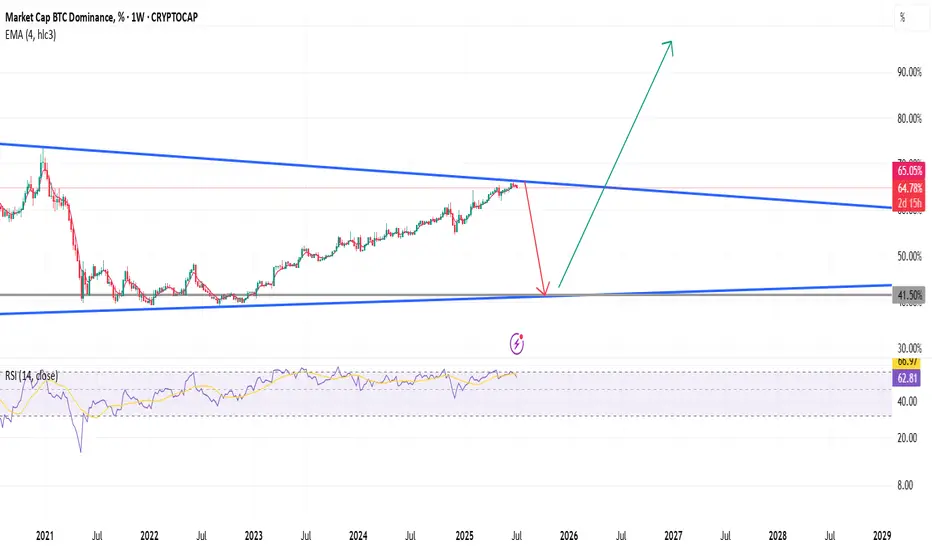
BTC DOminanceBTC Dominance is moving in a descending wedge in my view will fall to 41-42% in next 2/3 months starting altcoins massive bullis trend then reversal
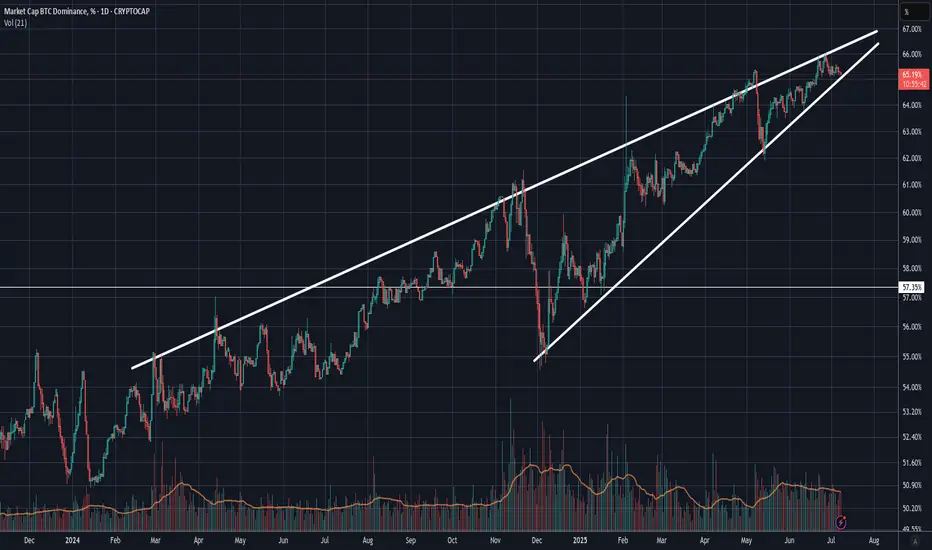
Bitcoin dominance chart ready to dump?Bitcoin dominance aka the btc.d chart has been in these 2 rising channels now for a long long tie, after ust recently being rejected down fro the top trendline of the neon yellow channel, there seems to be an opportunity here for it to potentially head down to retest the bottom trendline of that channel as well. If this occurs this could lead to an altcoin season. Price is right now combating the 50ma(in orange) and trying to maintain it as support. If this moving average flips to solidified resistance that greatly increases the chances of price going down to retest that bottom yellow trendline. Being that both of these channels are rising channels probability favors price action eventually breaking down from them instead of up so I have arbitrarily placed the measure move break down target of the yellow channel in a random spot below roughly where price could break down from the channel were it to be rejected strongly enough here by the 50ma. It’s retested this bottom trendline multiple times in the past and has always found away to avoid the breakdown thus far though so a breakdown there is definitely not guaranteed if it does retest the trendline, but even heading back down to retest the trendline in the first place may provide enough momentum for an alt season *not financial advice*
Violent DeclineBitcoin market share % looks ready to drop off a cliff. Took awhile to roll, but the moment has come. Altseason has arrived.
BTC Dominance Nearing Breaking Point – What It Means for Alts🚨📈 BTC Dominance Nearing Breaking Point – What It Means for Alts ⚠️🧩
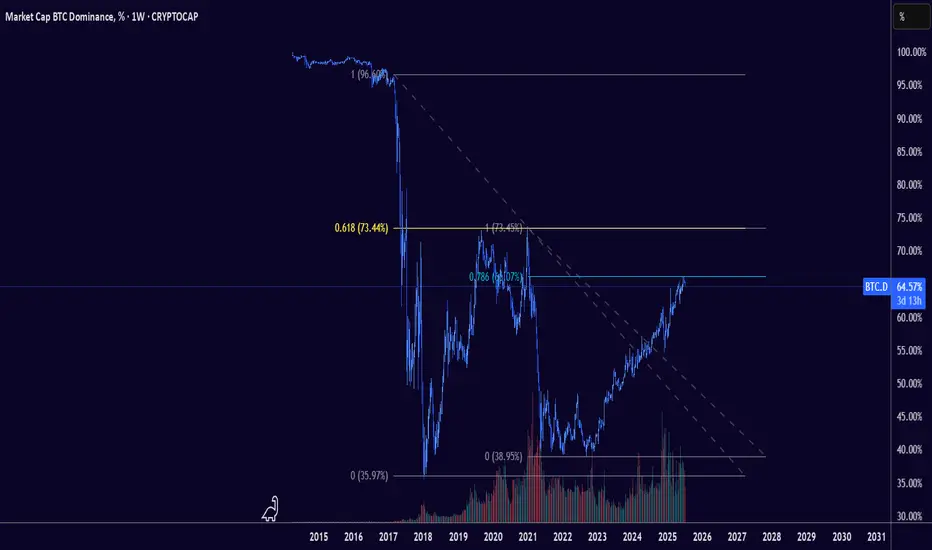
Bitcoin Dominance (BTC.D) is climbing — and fast. As of now, we're at 64.13% , officially in the “ Bad for Alts ” zone. Historically, this level has meant one thing for altcoins: trouble ahead . But what if we go further?
🔵 The chart tells the full story:
Above 73% dominance, we're not just bad — it's disaster territory for altcoins.
The biggest alt bull runs in history started when BTC dominance reversed from these high levels .
But now? We're riding a rising channel with no sign of slowing, and a potential peak at 71.34% could be next.
📉 If dominance hits that upper wedge, altcoins may face an extinction-level drawdown — especially if meme coins, scams, and greedy behavior continue to dominate the space.
🧠 As the chart says:
“The END of Alts would be back here…” (not a valid scenario in my opinion but it exists)
Unless fundamentals and real utility make a comeback, we may be heading for a cleansing phase — where only the strongest survive . And that's Bitcoin only.
🔎 Key Zones:
>73% = 🚫 Disaster for Alts
64–73% = ❌ Bad for Alts
54–62% = ⚖️ Neutral / Good for select alts
<45% = ✅ Historically Great for Altcoins
💬 What do you think? Is this a final dominance pump before reversal? Or are we witnessing the long-awaited re-centralization of crypto around BTC?
One Love,
The FXPROFESSOR 💙

BTC Dominance.BTC dominance hitting zone for reversal here, feel like it maybe ETH's time to shine. Alt season ahoy.
BTC.D Distribution ModelBTC.D finally confirmed it's distribution model. Technical target is the range low, invalidation above the high.

Bitcoin Dominance May Be StallingI have observed the Bitcoin Dominance for a while and I believe it's been forming a rising wedge, a typical bearish pattern. I wonder if this may signal a potential trend reversal.
Bitcoin DominationHistorical cycle data on the indicator points to the possible end of bitcoin's dominance growth. This may indicate the beginning of capital reallocation in favor of altcoins. At least until May 7 we will have a short-term altcoin season, but if we are lucky, even until the end of May.
⚠️ Caution Amid Geopolitical Factors
While a temporary altcoin season may be on the horizon, it's essential to consider broader economic factors. Ongoing trade tensions, particularly involving the U.S., could introduce volatility into the markets. Such geopolitical uncertainties might render the current altcoin rally a bull trap, with potential downturns in the summer months.

Will altcoins start to recover from here?BTC dominance is currently testing a key trendline resistance—mirrored by weakness in the Chaikin Money Flow (CMF) index as well.
Could this signal the start of an altcoin recovery?
If Bitcoin breaks above the weekly resistance zone at $114,000–$115,000, it would likely pave the way for a full-fledged altcoin season in the months ahead
Disclaimer:
This analysis is based on my personnal views and is not a financial advice. Risk is under your control.

Bitcoin Dominance Nearing a Top — Altseason Incoming in JULYBitcoin Dominance (BTC.D) is approaching overbought levels on several key oscillators across multiple timeframes. While the 1-Week chart still shows momentum that could push BTC.D slightly higher over the next few weeks, the indicators are signaling an upcoming shift.
📅 Timing the Rotation:
We're eyeing mid to late July as the likely window for a rotation into altcoins. This would mark the beginning of a potential mini altseason, where top-performing altcoins could outpace Bitcoin for a limited but lucrative period.
💼 Strategy Insight:
This could present a strong opportunity to trim or exit older alt positions from earlier in 2024—especially if they rally hard during this period of temporary dominance weakness.
🔍 Watch the oscillators and volume trends closely. The BTC.D reversal could be subtle at first but may lead to outsized moves in select alts.

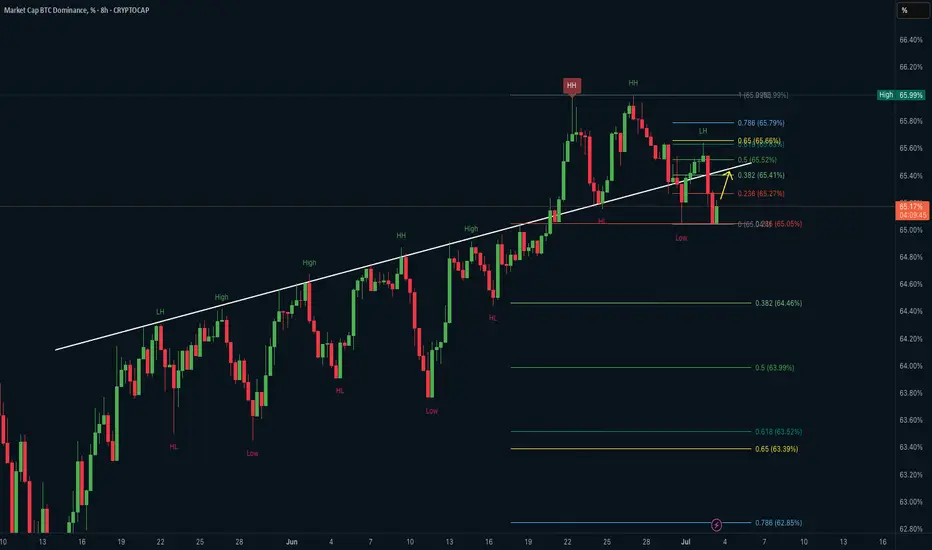
BTC Dominance – Trendline Break & Retest Zone Reaction in PlayThis analysis focuses on the 8 hour chart of Bitcoin Dominance (BTC.D), showing a possible retracement bounce after a recent market structure shift.
Key observations:
• BTC.D formed a higher high (HH) before pulling back sharply to a key demand zone.
• A long term ascending trendline has been broken and is currently being retested from below.
• Price tapped the 0.236 Fib retracement zone and is now bounce hard from that level.
• The yellow arrow suggests a possible short term move back toward the 0.382 or 0.5 Fib levels (~65.4%–65.5%).
Key levels to watch:
• Resistance: 65.52%, 65.66%, 65.79% (Fib cluster + previous LH)
• Support: 65.05% (local low), below which further downside may unfold
• A strong rejection at the 0.65 level could confirm lower high structure continuation
BTC Dominance is important for altcoin traders:
A rise in BTC dominance usually indicates capital rotating into BTC and away from alts, while a drop opens opportunities for altcoin strength.
BTCDIs this chart not crazy to look at.
You didn’t even have to front run alts this cycle just still in BTC until it’s time.
This next candle you would think we will see red.
BTC.D Daily – Bearish ShiftBTC.D on the daily is turning bearish.
PSAR has flipped bearish, and MLR < SMA < BB center — a clear sign we could see lower levels ahead.
The next possible support is the 50MA.
Always take profits and manage risk.
Interaction is welcome.

$Btc.dnever thought we would get so high ... heheh no pun intended
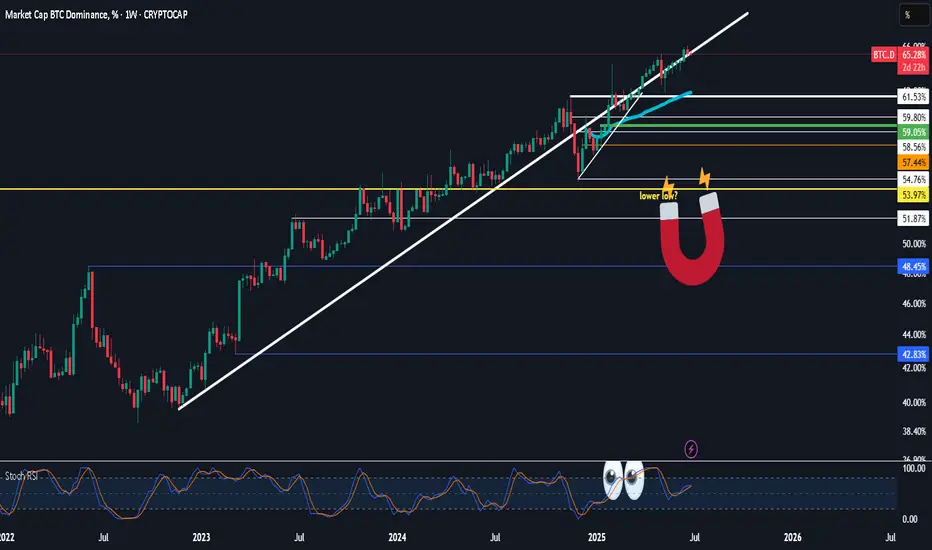
so following up on my wif trade thoughts this is where the fun begins for alts with volatility along the way and time to swap to bitty at the magnet .. hwoever long it takes
rsi just needs to roll over and we wait and see the weekly close for confirmation really doubt we push higher but if bitty decides to leg up then we just wait some more
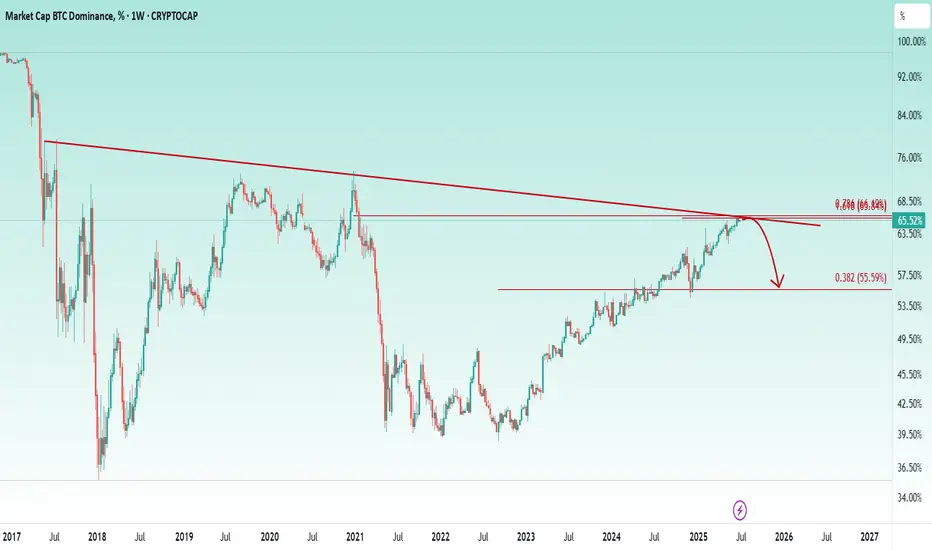
BTC Dominance about to reject, good news for alts 👉 Bitcoin dominance has reached a highly critical trendline, which also coincides with a strong PRZ. Personally, I expect a rejection and a correction from this area, which could potentially lead to a positive trend in the altcoin market.
⏳ My trigger for entering altcoins is a bearish signal on the lower time frame of the Bitcoin dominance chart. So until that happens, I prefer to stay patient and remain out of the market
It's over for BTC Dominance, benjamin cowen is wrong hereAlt rally time :) . it will be incredibly hard to overcome this resistance on the chart. Don't listen to benjamin cowen at this point, he is too bullish on btc still. Cya in a few weeks when he changes his mind.
BTC.D Showing Cracks ?Hello Traders 🐺
In this idea, I want to talk about one of the key factors driving the crypto market — something we all know plays a major role: BTC Dominance (BTC.D). In my opinion, understanding BTC.D movements gives us a powerful edge if we interpret them correctly.
Let’s break it down:
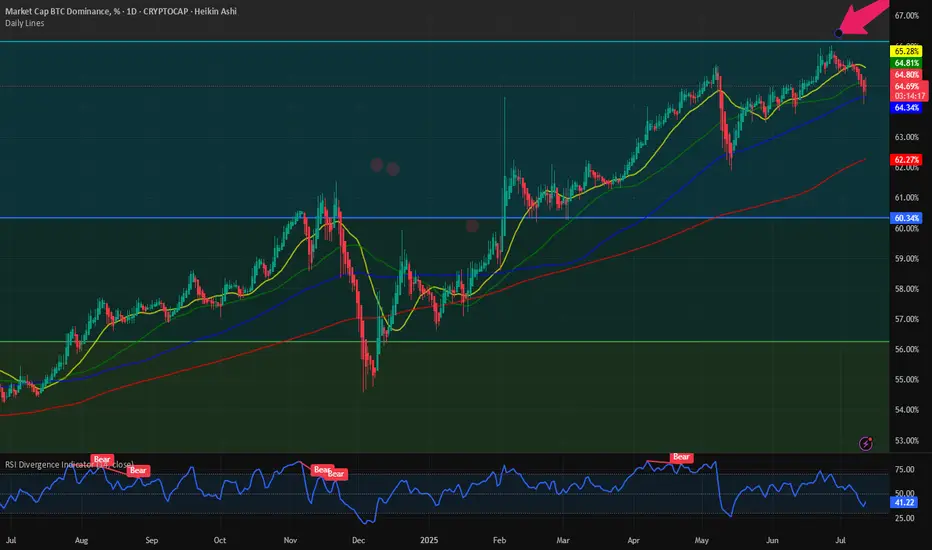
📉 On the daily chart, we’re seeing clear signs of weakness.
First, there’s a bearish divergence on the RSI. For those unfamiliar, this occurs when price makes a higher high, but RSI makes a lower high. It’s a signal that buying pressure is fading — meaning fewer buyers are stepping in compared to the previous push. This is a classic early sign of a potential trend reversal.
Second, price is forming a rising wedge, which is typically a bearish pattern. If this plays out, we could see BTC.D drop toward the bottom of the wedge, aligning with the ascending channel’s support — where a potential bounce might occur.
📌 But here’s the big picture:
We are very close to what could be the start of Altcoin Season, and I’ve been emphasizing this almost every week. I encourage you to review my previous idea on BTC.D for a deeper perspective (linked below this post).
Stay sharp, stay disciplined — and be ready for the volatility ahead.
🐺 Discipline is rarely enjoyable, but almost always profitable. 🐺
🐺 KIU_COIN 🐺

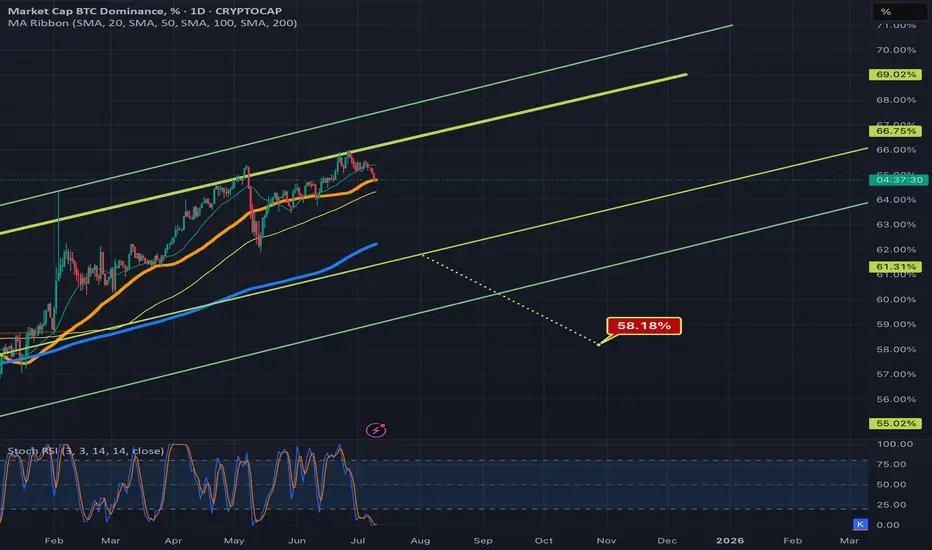
BTC.D Slipping ! ALTSEASON Loading ? This is BTC.D on the daily chart.
It has shown a strong relationship with the 50MA (blue/cyan line), often using it as support. While there were a couple of daily closes below it in the past, they lasted only 1 or 2 candles.
Now we’ve seen 4 consecutive daily closes below the 50MA (including today), which increases the likelihood of a deeper move to search for support.
The next key support zone (green rectangle) is defined by the 200MA (red line) and the 62.25% level (black line) — both of which acted as support before.
If BTC.D drops into that zone, ETH and altcoins could experience a strong bounce.
Always take profits and manage risk.
Interaction is welcome.

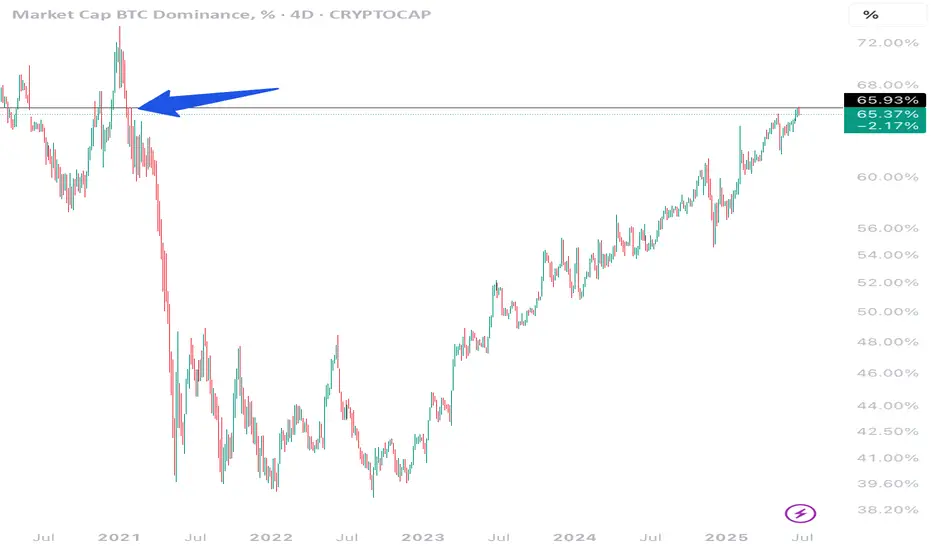
$BTC.D: Failed breakout above 66%. Was that it? Time and again we investigate the CRYPTOCAP:BTC dominance chart. In my opinion it is the most important chart in the Crypto markets. I have supported the idea that we will see CRYPTOCAP:BTC.D touch 66% in this market cycle. In my first blog on this topic on April 14th I published the idea here in Trading view.
CRYPTOCAP:BTC.D to 66%, CRYPTOCAP:TOTAL2 / BTC down to 0.43 for CRYPTOCAP:BTC.D by RabishankarBiswal — TradingView
Since April time and again we looked at this chart and since I first preached the idea of CRYPTOCAP:BTC.D to 66.2% from 63% in April we had some hiccups in the way where the Altcoins tried to claim leadership. On May 20th I indicated that the short-term blip is not consequential.
CRYPTOCAP:BTC.D : Have we seen the top or a local top in the CRYPTOCAP:BTC.D ? for CRYPTOCAP:BTC.D by RabishankarBiswal — TradingView
We reaffirmed our view on June 22nd, and we confirmed our commitment to CRYPTOCAP:BTC.D to 66%.
CRYPTOCAP:BTC weathering the storm: CRYPTOCAP:BTC.D close to 66%. CRYPTOCAP:BTC to 160K. for BITSTAMP:BTCUSD by RabishankarBiswal — TradingView
We briefly touched 66% and failed to breakout on June 27th. Now we have hit an air pocket. In my opinion this should also pass. Confirming my view of CRYPTOCAP:BTC.D to 66.2% and 160K $BTC.
Verdict: CRYPTOCAP:BTC.D will cross 66.2% before all set and done. Price performance of Altcoin can be good going from here.
Verdict: CRYPTOCAP:BTC.D will cross 66.2% before all set and done. Price performance of Altcoin can be good going from here.
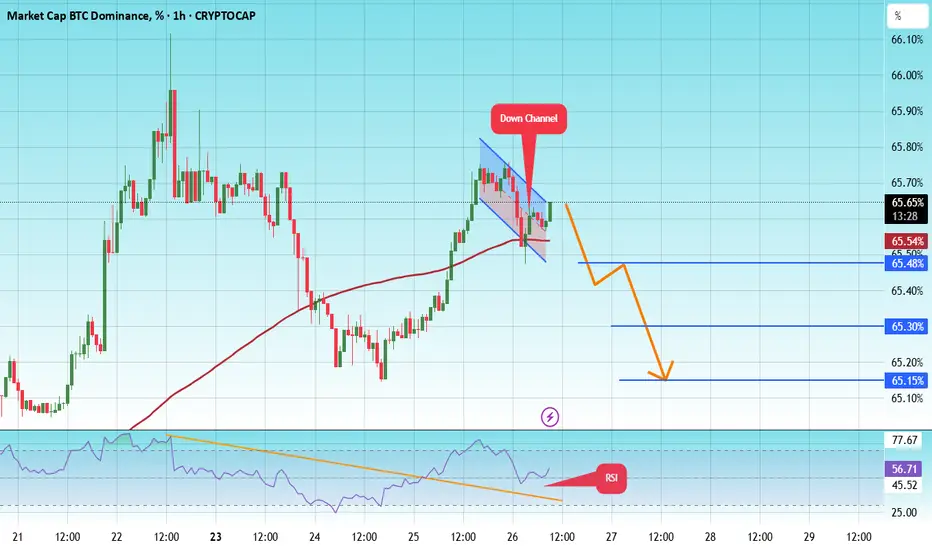
BTC Dominance New Update BTC.D
We are at a critical juncture in Bitcoin's dominance.
A major decline in Bitcoin's dominance has likely already begun. If the green zone is lost, dominance could see a sharp decline, especially since the last wave of this diagonal pattern, Wave G, touched the 0.618 Fibonacci level.
However, there is still a possibility that the green zone could push the price back close to the previous high before we see a decline in dominance. However, there are also indicators that the major decline may have already begun. Follow the chart closely and monitor it closely.
First Target: 65.50%
Second Target: 65.30%
Third Target: 65.15%
To manage risk, don't forget about stop loss and capital management.
Bitcoin Dominance :When altseasonOnly 63 days left until we will start witnessing another altseason.
2 more months and the path to a crazy alt run will begin.
Let us be patient.
