Bitcoin Dominance 2018-2021 x 2022-2025#Bitcoin Dominance 2018-2021 x 2022-2025 ➿
CRYPTOCAP:BTC.D January is right there when repeated waves move into the Correction phase and the #Altcoins recovery begins!
BTC.D trade ideas

BTC Dominance AnalysisCurrently BTC dominance is on 59% (again).
The structure (Blue line) needs to break to the down side for ALTs season to start.
Until dominance falls, Bitcoin is king.
I don't think dominance will go higher than 61%, but it is possible.
The down side target is between 35% -40%.

BTC.DBTC dominance is on 59% again.
The structure (Blue line) needs to break to the down side foe Alts season to start.
Until dominance falls, Bitcoin is king.

DOMINANCE - retesting almost done!The market is experiencing a terrifyingly bearish phase, and the start of the week is concerning. However, everything will be fine soon.
We can see this through the dominance chart.
On the weekly timeframe, the pattern has broken downward, and a retest is now in progress.
This current pressure on altcoins aligns with the dominance chart retesting its breakdown.
It’s expected that dominance could rise to a maximum of 61% before altcoins break free from this nightmare and finally deliver the long-awaited profits.
Personally, I’m still holding onto my altcoins and strongly advise against selling. Everything will improve in the coming weeks.
Altcoins are currently at bargain lows that are worth buying.
Best regards Ceciliones🎯

RSI AnalysisRSI Length: 50
MA Type: SMA
MA Length: 50
Historically, when RSI is below SMA on this setting, it means the start of alt season. One thing to pay attention to is that RSI is trying to break above the SMA line and if RSI fails to break above the SMA line, it is a confirmation that btc will lose value against alts. People have been calling for alt season since 2022, but still nothing has happened and this chart also does not confirm or predict an alt season. I’m just pointing out what has historically happened to the Big D based on RSI chart.

BTC.DBitcoin Dominance Index
Given the relatively strong downward leg we experienced in the past, followed by a weak upward correction from the identified zones, we might witness a drop or further correction in the Bitcoin Dominance Index.

BTC.D - Official Alt Season ?Charting this on a weekly timeframe is tough, so use it as a reference point only.
I’ll provide more precise analysis on lower timeframes, but this represents my general macro outlook. But: Start preparing for an Exit Strategy. You are warned.
1st area of Interest = Green Box (45-46%)
2nd area of Interest = 43% Horizontal Support and close Trendline Support
3rd area of Interest (in case we got very lucky) = 39.70%

Bearish Divergence The big D is forming a bearish divergence on the 4H chart. That’s it. That could mean the last might outperform btc for a few days.

Bitcoin Dominance Analysis:Zone A (Resistance Area):
The highlighted white box represents a strong resistance zone for Bitcoin dominance. The chart has tested this level multiple times but has failed to break it so far.
If Bitcoin dominance manages to break this level, it could signal further upside momentum.
Potential Move to Zone B:
The blue arrow indicates a possible corrective move if Bitcoin dominance fails to break the resistance at Zone A.
Zone B, the highlighted gray box, appears to be a significant support area. A reaction can be expected if the chart moves toward this zone.
Sure! Here's the analysis in English for your TradingView post:
Bitcoin Dominance Analysis:
Zone A (Resistance Area):
The highlighted white box represents a strong resistance zone for Bitcoin dominance. The chart has tested this level multiple times but has failed to break it so far.
If Bitcoin dominance manages to break this level, it could signal further upside momentum.
Potential Move to Zone B:
The blue arrow indicates a possible corrective move if Bitcoin dominance fails to break the resistance at Zone A.
Zone B, the highlighted gray box, appears to be a significant support area. A reaction can be expected if the chart moves toward this zone.
Scenarios:
Bullish Scenario: If Bitcoin dominance successfully breaks above Zone A, it will indicate Bitcoin gaining strength relative to altcoins. This could mean a shift of liquidity from altcoins to Bitcoin.
Bearish Scenario: If Bitcoin dominance fails to break the resistance and moves downward, the next target will likely be the support zone at Zone B. This could signify increased focus on altcoins.

Btc dominancealt coins will gain against btc for a few days we can start to see it money flowing to alts as btc dominance retraces btc dominance going down means money flows back to alt coins and eth . Every bull cycle after btc finish going up money flows to alt coins . I think the major alt coin bull run has not yet happen because btc has not reach the top i think btc tops at 120k so be patient the alt coin bull run will start soon.

Bitcoin Dominance Update: Alt-Season around the corner!Bitcoin dominance is still in an obvious uptrend and in my opinion we can have a potential scenario as illustrated on the chart which the dominance will have a spike up to %68 as Bitcoin records new all-time highs and the alt-season that we all are waiting for will start right after hitting this level around Mid-February.
This analysis will be invalidated if the dominance closes below %56 before making new high above %60

BTC.DGang we see this dropping thats about it lol. Honestly nothing too much to say about it. it just finished taking low side 4hr liquidity so lets see how it reacts from now, but honestly this needs to drop hard in order for alt coin season to kick in.

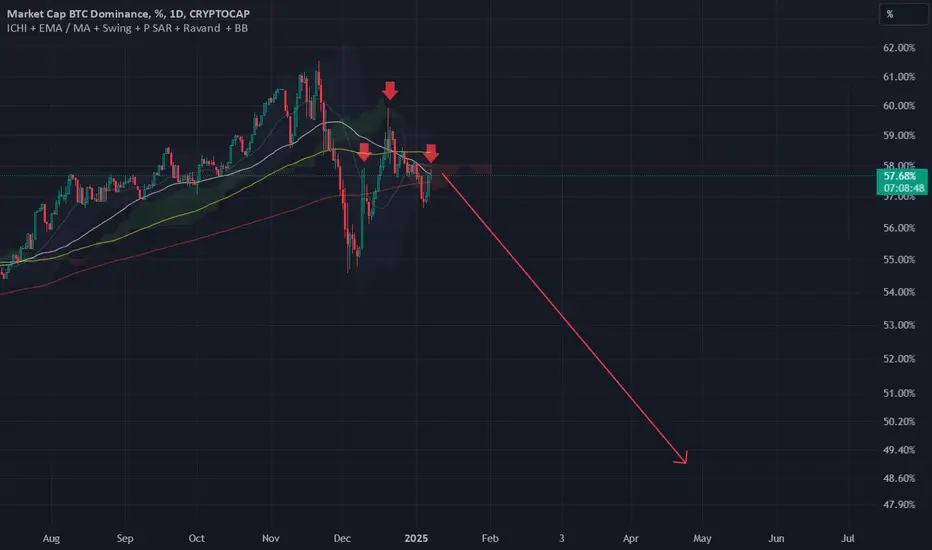
an insight on BTC's dominanceCRYPTOCAP:BTC.D
✅ Bitcoin Dominance has formed a double top below the 59.15 resistance on the four-hour time frame, which could once again move towards its short-term uptrend line if it breaks the 58.37 support 👌
✅ Bitcoin Dominance needs to break the uptrend line and support at 56.79 on the daily time frame to start its new downtrend 👍
⚠️ Disclaimer:
This is not financial advice. Always manage your risks and trade responsibly.
👉 Follow me for daily updates,
💬 Comment and like to share your thoughts,
📌 And check the link in my bio for even more resources!
Let’s navigate the markets together—join the journey today! 💹✨

Skyrexio | Bitcoin Dominance: Altseason Is About to Be CancelledHello, Skyrexians!
We know how you wait for the altseason, but market is about to make the new shakeout! The CRYPTOCAP:BTC.D drop in November 2024 gives us the belief that all altcoin holders will be rich, but it has started to go up again with slow altcoins bleeding. Now we have the last chance to be saved. If now, say hello to new lows for altcoins.
Let's take a look at the daily chart. Dominance dropped after printing the Bullish/Bearish Reversal Bar Indicator . We still count this wave as the wave 1. The wave 2 in our opinion is happening now. This wave has the ABC shape which has the chance to be finished now inside the Fibonacci 0.618 target area. Moreover we can see red dot on the indicator. Next week will be decisive for crypto market. If dominance will decrease from here we will see the altseason soon.
Best regards,
Skyrexio Team
___________________________________________________________
Please, boost this article and subscribe our page if you like analysis!

BTC Dominance repeating itself?If this is going to be similar to what BTC Dominance just did.. We should see a jump slightly above 60% 2 more times before the next cascading drop.. Will it happen again? NFA Godspeeed!

Bitcoin Dominance, is it telling us what is happening?Bitcoin Dominance - In the 2021 top, BTC.D put in its top just before BTC put in its top. Altcoins were rising as BTC.D was topping, and then altcoins got their crazy parabolic tops as BTC.D was having its first initial drop from its cycle top. Dominance topped just before BTC went to 42K, and had its first 30% correction post covid-crash, which was JUST before it (BTC) went up and put in its cycle top. Currently Bitcoin Dominance is surviving the 58% key S/R, and looks like it may push higher on a 1W and 2W basis.
So, even though Bitcoin has bearish divergence all the way up to its 3W chart, Dominance makes me think that BTC is going to push through it and go higher where it then might repeat something similar to what it did in 2021 - do a correction at that point after Bitcoin dominance peaks, and then Bitcoin peaks as altcoins have the blow-off top phase of their cycles as Bitcoin dominance has its initial fall from its cycle top.

Bitcoin Dominance targetsMany people now waiting BTC dominance over 60%. I dont think so we will go so high!
CRYPTOCAP:BTC.D
We can't compare market cap 2020 and 2024. We got many new projects who absorb liquidity from investors! Yes based on BTC ETF majority inflow money in Bitcoin
51.20% was a previous support for BTC dominance in 2020 now its can be like resistance
Locally we formed triangle with fake out
2 possible scenarios for Btc dominance marked on a chart
Time to out of alts also marked green block everything what is 44-30% btc dominance will be a signal to out of altcoins 100%
Hope you enjoyed the content I created, You can support with your likes and comments this idea so more people can watch!
✅Disclaimer: Please be aware of the risks involved in trading. This idea was made for educational purposes only not for financial Investment Purposes.
---
• Look at my ideas about interesting altcoins in the related section down below ↓
• For more ideas please hit "Like" and "Follow"!

The Big Thick DThe big thick D is getting ready to launch against your sh**coins. After this launch, you may have a chance to see altseason after all, but for now btc will have its pump and the alts will have to just wait.

Is It Right Time To Buy Alts??**Bitcoin Dominance Update**
BTC.D is attempting to break the yellow resistance zone but has yet to succeed. This indicates that **altcoins still lack the momentum** for a strong buy opportunity.
Currently, BTC.D remains **below 58.72%**, which suggests the market is **not yet in a bullish phase**. However, there’s **no clear reversal confirmation** either.
**Key Takeaways:**
- **No buy signal for alts yet** – wait for BTC.D to show clearer movement.
- **Not bearish, but not bullish** – the market remains in a neutral zone.
- **Patience is key** – wait for a confirmed breakout or reversal before making moves.
Stay tuned for updates! 🚀

$btc.dlets see if we deviate back below this and kick off some green accross the board.
rsi wants down
is this a lower high on HTF ?
tbc ..

BTC.D Dominance of BTCdidnt buy Altcoin yet ? so its time . u can see Pattern of Head and Shoulder . Altcoin pump soon
ALTSEASON Q1 2025I believe there's still hope for an altseason in Q1. For this to materialize, we need to see USDT.D and DXY trending downward. Based on my thesis, we are currently within the A/W wave, presenting a strong potential for an altseason during the remainder of Q1.
During this period, altcoins could hit new all-time highs, with undervalued tokens likely to experience significant pumps as well.

Dominance :PARTY TIMEAnother retest at this region around 58%-60% then i think this will start to reverse to the downside.
February will be great for alts.
Altseason will soon start.
