Bitcoin DominanceBitcoin Dominance broke the rising wedge pattern in downward direction as expected. Altcoin are showing some upward movement and we may see good rally if BTC remains stable in a range. We may see a drop to the local support area of 61.90%-62.20% in the following week.
BTC.D trade ideas

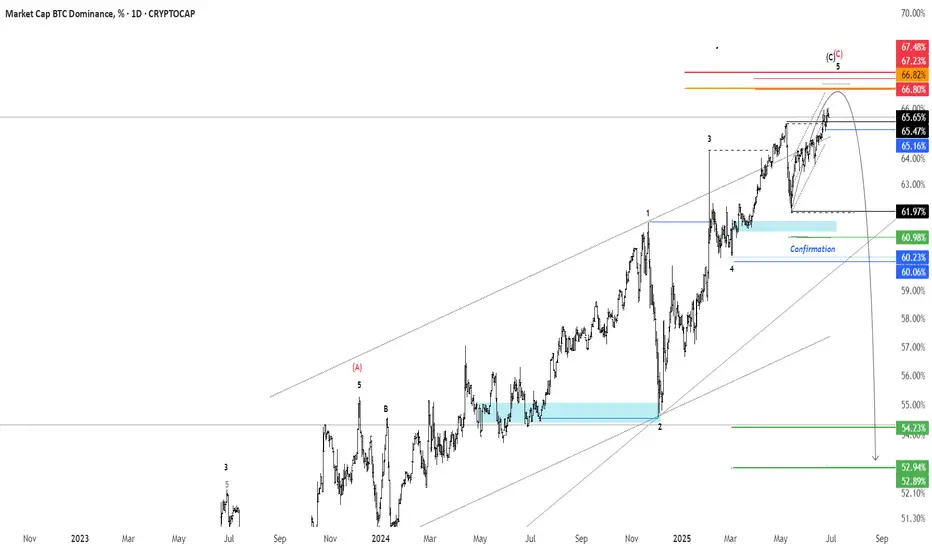
BTC.D - 1D Timeframereversal zone 66.8 : 67.2%
Confirmation : 60.23%
Targets : 52.94% / 31.03
invalid : 67.48%
BTC.D Nearing a Historic Inflection PointBTC Dominance (BTC.D) is fast approaching the 67.64% resistance level, sitting firmly within a key supply zone marked at point D. This area represents a high confluence region, aligning with a long-term descending trendline and the upper boundary of a bearish wedge structure.
If validated, this would complete a potential ABCDE reversal formation suggesting a macro top in Bitcoin dominance may already be forming.
A rejection from this zone could trigger a pullback towards the immediate support at the 60% level. Should this level break, further downside may unfold toward 54.64%, with a deeper long-term target resting around the 45% zone.
This setup could mark a significant turning point if dominance begins to unwind, we may witness an aggressive rotation into altcoins. Keep a close eye on structural breaks and liquidity sweeps.
Alt season might just be closer than we think.
What’s your take on this potential shift? Let’s discuss in the comments.

JULY IS THE ALTCOIN SEASON
"We will witness the last rise at 68, and the altcoin season will follow after that. Be ready."

BTC.DI was expecting the drop to happen a bit earlier, but this zone is where the reversal to the downside begins. Now we should wait for the start of the altseason.

₿itcoin Dominance New Cycle High 66% ₿itcoin Dominance reaches new cycle high tapping 66%
If there's one thing I learned this cycle, it's never to sell your CRYPTOCAP:BTC for Alts.
If you want to play the casino, play with USD 💯

BTC.DBitcoin’s dominance is sitting at a crucial 65% level, and the market is at a crossroads. This zone has been a major battleground before—will history repeat itself?
If BTC.D holds and breaks higher, we could see a return to Bitcoin’s dominance, pushing toward 70% or more. That would mean alts bleeding against BTC, and traders might want to focus on BTC pairs or even short weaker altcoins.
But if this level rejects and dominance drops back under 63%, it could be the signal for an altcoin rally. Money could quickly rotate into ETH, SOL, and high-beta plays, especially if BTC consolidates.
The key triggers? Watch ETF flows, macro sentiment, and volume. A clean breakout or breakdown will set the tone.

BTC.D ANALYSIS BTC.D – Daily Chart Analysis 🧠
Bitcoin dominance is forming a rising wedge pattern – a typically bearish structure.
We’re now at the upper resistance; a rejection here could trigger a strong move down, opening the path toward 56–57% levels.
If confirmed, altcoins might get temporary relief.
Watch for a break of the lower trendline for confirmation.
Not financial advice – DYOR

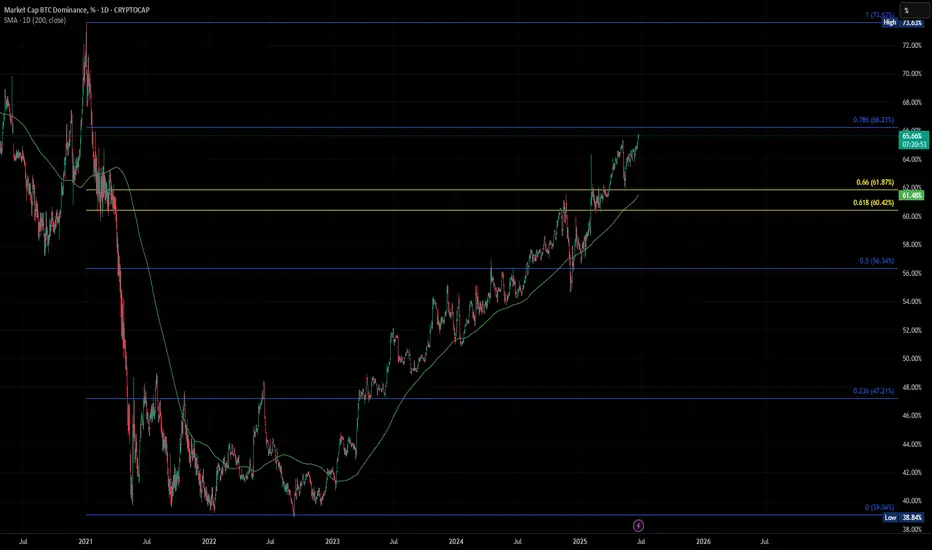
I'm having illusionsBTC.D is back at 65% (White Line) — same level we saw 5 years ago (5 years is a natural market cycle). In Dec 2020, it spiked to 73% (Green Line) before dipping hard... and that drop kicked off the last real Altseason.
BTC.D dipped to 40% by May 2021 (Orange Line)
ETH pumped +470% 🚀 in that window. A few months later in Nov '21, ETH hit its ATH of $4,878 (Pink Line)
Fast forward to now:
BTC.D is climbing into a historic 70% (Yellow Line) resistance zone (pre-alt era levels). I’ve set an alert for 69%, which is just below that pre-altseason rejection zone (69 is also a natural number, if you know what I mean)… so it’s a critical level to watch.
Despite Ethereum being criticized by some as a “relic,” its market capitalization is still vastly higher than the next-largest alt, XRP, by over $166.9 billion. That’s a huge footprint in the crypto space; it's still very much a market heavyweight IMO. ETH/USD likely to decline near term. Watch for a potential rebound by end of Q3.. #NFA
Not saying history will repeat... But if it rhymes again — I might turn off the charts for a night and go dancing!

Bitcoin DominanceI'm posting this again just to antagonize the haters, because there are those people who understand zero technical theory. It's the blind leading the blind out there. I fattened up the candles, hoping it will be easier for you to see the gap that I'm talking about.
Some technicians might argue, "yah, but that only works on the price, not on ratios". But that argument doesn't work on a seasoned technician like me, who traded crypto currency pairs on Pololniex for three years straight. You are speaking from complete ignorance, and I know what I'm talking about.
Thank you for your attention to this matter ;-)

#Altcoins will pump in Q3I think this is a valid possibility for Q3.
Moving forward I think we might see Bitcoin Dominance fall in Q3.
What are your thoughts?

BTC Dominance Nearing Major Reversal Zone?Dominance has been grinding higher for months, but it's now walking into heavy resistance, and the structure looks like a rising wedge (not a great sign for bulls).
This setup often ends with a breakdown, which could be the spark altcoins are waiting for.
It’s not confirmed yet, but the chart’s starting to hint at a shift.
Watch closely, big moves usually follow tight squeezes.


Altseason Loading? BTC Dominance Hits Key Resistance!The BTC Dominance chart is once again testing a key long-term weekly resistance.
Historically, this trendline has marked major turning points, and each rejection has given altcoins room to rally.
If we see another rejection here, it could mark the beginning of a strong altseason.
Like and retweet if you are with me! 🤝
#ALTSEASON INCOMING! 🔥

Bitcoin Dominance Topping Outhi ,as a brief update Bitcoin Dominance continues to climb and alts go down as a result.
there are many indicator that are signaling a new top for BTC D (like TD9 and more)
this last candle has another week to close, so Alts are not out of the woods yet !

BTC Dominence Update🚨 BTC Dominance Update 🚨
Once again, BTC Dominance (BTC.D) is showing strong bullish momentum! 📈
After a shallow retracement, it has regained strength and is continuing its upward climb. This confirms that Bitcoin remains the top performer in the current market phase.
🔺 Arrow #1 & #2 – Key resistance levels to watch.
🟢 Arrow #3 & #4 – Strong support zones that held well.
🔻 Arrow #5 – The deep retracement point. A breakout from this zone was the first bullish signal for #ALTs
💡 This is exactly why I’ve been avoiding buy trades in altcoins in our group. The dominance chart is crystal clear:
⚠️ This is not the time to rotate into alts.
🔥 Focus on Bitcoin! It's leading the market, and that’s where the momentum is.
📊 Stay disciplined. Stay focused.
🎯 Trade smart — this phase is all about BTC!
\#BTC #BitcoinDominance #CryptoUpdate #AltsOnHold #FocusOnLeaders #TradeSmart

Altseason isn’t cancelled, it’s just delayed. Here's WHY!CRYPTOCAP:BTC Dominance Update:
Altseason isn’t cancelled, it’s just delayed.
The key zone to watch is 69.5%–73% dominance. That’s where we’re likely to see a strong rejection if it doesn't start soon, which seems unlikely given the current circumstances.
The longer it takes to reach that level, the stronger the altcoin rally will be once it hits.
This isn’t hope, it’s exactly what the charts are showing.
Historically, 70% dominance has acted as a major reversal zone.
If there are signs of reversal before this level, I'll let you know beforehand.
So follow me if you don't and share this chart with your crypto friends.
Do not forget to keep cash/stables!
Let me know what you think in the comments.
Thank you
#PEACE

Altseason still possible | Bitcoin D. On ResistanceBitcoin Dominance is sitting on a resistance zone, reached the last liquidity wick. I still expect the altcoins to go up from here, since there is no valid breakout above this level.

Is Altseason Around the Corner? BTC.D looks tired AF!BTC dominance just hit the top of a rising wedge that has been building for over a year. Price is stalling at 65.64 percent, sitting right against long-standing resistance.
Momentum is weakening. Stochastic RSI is at 72 and starting to roll over. RSI is sitting just under 70 and showing early signs of fading.
The structure suggests we are close to a decision. If BTC dominance starts to fall from here, the conditions for an altcoin run are in place.
Key levels to the downside are already mapped. First is 59.97 percent. Then 58.70 percent. After that, 56.88 percent. The 100-week simple moving average is also sitting at 56.51 percent. If dominance breaks below that level, it opens the door for a larger shift in market flow.
Previous retracements in BTC dominance have aligned with strong moves in altcoins. This current setup is technically clean and nearing resolution.
It is not confirmed yet, but the signals are starting to stack. This is a moment worth watching.

Weird cycle for alts Weekly update for this check lately has been painful
Outside of XRP and a few others it’s been a difficult ride this alt season.. weird to say the least . We were doing better in 24 than the Trump rally last November/Dec
Been pretty much downhill ever since.
While BTC still over 100k I fell we still have a chance but this alt season window is closing fast.

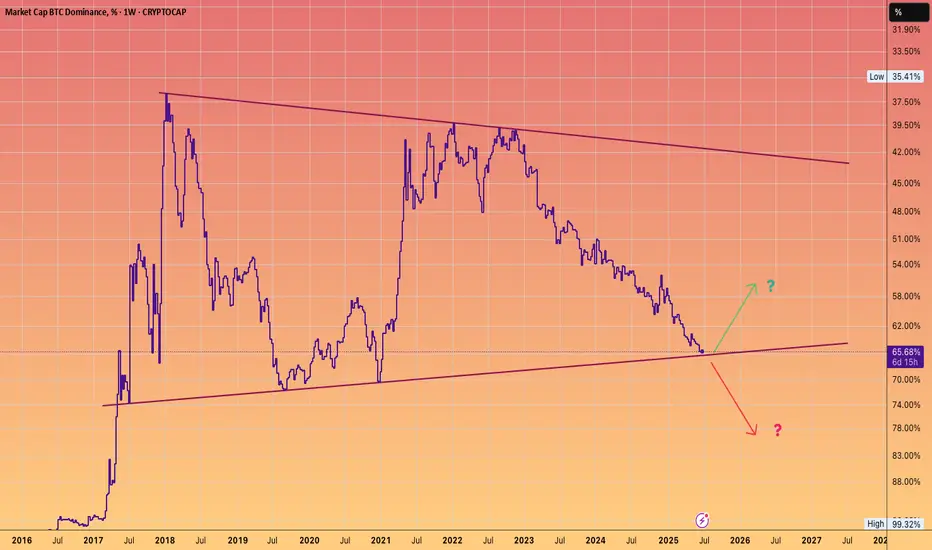
BTC DOMINANCE at pivotal juncture.Which direction do you favour?
The chart is inverted, so the up move will result in #Alts outperforming #Bitcoin.
BTC.D + USDT.D + USDC.D > FLIGHT TO SAFETY SurgingStructures are being broken across the board 🚨
Looks like the Flight to Safety chart is closing the week at a new cycle ATH.
Should push to 74% before we see a meaningful turn around.

BITCOIN DOMINANCE DECODED! Hey crypto crew!
BTC.D is hitting new cycle highs—up it goes, pump or dump, it doesn’t care!
It trends up more than down and won’t dip until monetary policy shifts (QT tightening needs to end—maybe 100+ basis points in rate cuts?).
Altcoins? Just wobbly sidekicks—stick with BTC, the "King," unless you want your portfolio to crash!
Quick Take: BTC.D could blast past 66% and overshoot, then maybe consolidate. Watch war conflict vibes and wait for a policy flip.
Altcoin lows might hit Aug/Sep—hold off unless you’re feeling lucky!
Stack sats, stay sharp, and ride this wave!
Disclaimer: Not financial advice.
Consult a pro!