Bitcoin Dominan Breakout Regression ChannelDominance breakout in 65.25 and first target will be going to 65.90 - 66.20
And max pain for this scenario dominance will up till 66.77
max pain will be success i think if Iran and Israel war scale up with US
BTC.D trade ideas

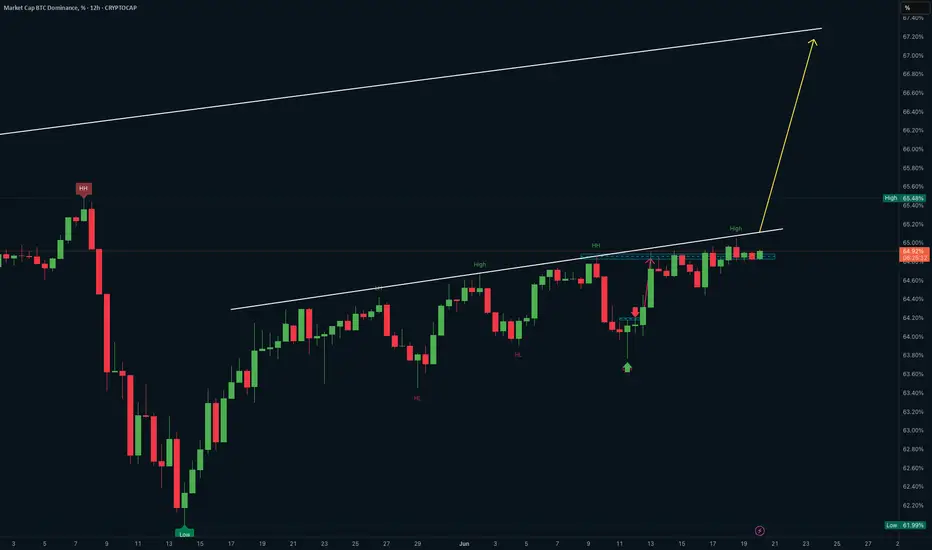
Bitcoin Dominance (#BTC.D) UpdateBTC.D building strength and is now sitting just below a key resistance level. The chart shows a series of higher highs and higher lows. Tha's a bullish sign. If it breaks above this range, we could see a strong push toward 67%.
This move would likely mean a massive ALTS sell off. Good to be safe if you're in a LONG! 😈
BTCUSDT.DBTCUSDT.D
ALT SESON COMING SOON
This is my opinion: Bitcoin dominance has reached its top and might show a breakout to the upside, but it could turn out to be a fake breakout. Overall, we should expect a decline in BTC dominance and the beginning of capital inflow into altcoins. Perhaps if there hadn’t been negative news, this shift would have happened sooner. Altseason might be approaching.”

Bitcoin Dominance (BTC:D) Update - 19.06.2025🚨 Bitcoin Dominance (BTC.D) Update – 19.06.2025 🚨
As highlighted in my previous analysis, BTC Dominance has broken its key retracement trendline – a significant move! 📉 But let’s be clear: the breakout hasn't been fully confirmed yet. Market momentum is still uncertain, and we must stay alert as BTC.D could go either way from here.
🔍 Let’s break it down:
📌 Arrow #1: This remains a strong resistance zone. If dominance breaks and closes above this level with strength, expect serious pressure on altcoins. Historically, such moves lead to red across the board for alts. Be cautious! 🩸
📌 Arrow #2 & #3: These are the local resistance and support zones from the past 12 days. They are key in identifying short-term moves and fakeouts.
📌 Arrow #4: A break below this level would give a strong signal to reopen positions on altcoins. We’re closely watching this area.
📌 Arrow #5 & #6: These are the most important support levels. If BTC.D breaks down here, it could mark the beginning of Altseason – the moment we’ve been waiting for! 🚀
💡 Summary:
We’re in a critical phase. Break above resistance = pain for alts. Break below support = altcoin opportunities will explode. Stay disciplined, stay focused. 📊
🔥 Ethereum update coming next… stay tuned, fam!
\#CryptoUpdate #BTC.D #Altseason #BitcoinDominance #Altcoins #TechnicalAnalysis #EthereumIncoming


At some point,......this thing has to go down, and technically, it still looks like this could be it. It's the monthly, so it could still go sideways for a while, but it looks like a completed channel before the breakdown.

is this altseason? regardless the war? Oli? CPI? ...CPI must fall under 2.0%
Oil must retrace to the $70s
Fed must signal a real cut, not conditional pause
DXY must fall below 103
Until then, BTC remains the vault,
and the rest of the crypto market remains the graveyard.
Alts are complexity.
Ethereum is complexity.
Smart contracts are complexity.

BTC.D+ETH.D+USDT.D+USDC.D InsightsAn interesting chart with BSL still to take and pushing for it.
If you study the time cycle of last cycles altcoin season you will see that it occurred after this chart took the range highs and BSL and then distributed from there to new lows
I believe we are seeing the same scenario setting up in this chart and data with it pushing to the BSL and range highs into supply, before a possible reversal bearish kicking off the final altcoin cycle and season.
We shall see... One to add to your watchlist!

BTC.D - Could it be Wyckoff Distribution DevelopingJust toying with ideas of what may be developing here so dont take the chart as what i think will happen perfectly as shown.
With the strength seen from BTC.D atm, it looks more and more likely it may go for the highs again and into the higher levels above 65%.
I still see this as a very large range from the february high and lows that got put in and the prior high was a deviation of the larger range resulting in the reaction we seen.
We could expect to see a further deviation of the range highs and this wouldn't be uncommon in the development of a wyckoff distribution range.
Im still looking for a HTF reversal bearish from these supply levels and my bias doesnt change right now as we continue to develop this range until proven otherwise.
That being said, we could see some further weakness in altcoins until this tops out and gives us the right confirmations of a trend shift bearish.
1D:

BTC Dominance Looking very bullish CRYPTOCAP:BTC.D should go up towards 66% and expect the CRYPTOCAP:OTHERS to take a hard dump. Bull flag pattern in the short term.

BTC.D travelHello,
60% turned to support. 64% is FWG, it's probably going through this summer. Our next target is 68 - 80%
I am going to buy gradually from here.
For the BTC, I have been short since 111.500. Almost hit the ATH :-( Next target below 60k.
For Altseasoners, your alts are going down 60-80% from current lows. For example LTC worth 100 will be worth 35, enjoy the ride.

Altcoin dominance about to explode!This chart looks BULLISH as hell!
My guess is that the inverse Bitcoin dominance will explode higher.
The question is how high? I think Altcoin dominance could go to 70% .
Past altcoin cycles always went above the last peak.
We need to beat 65%.

Once again…BTCD under the 20MMA
If Stays under and drop
Alts rally
Above …
More pain.
Continues to be a game of patience.

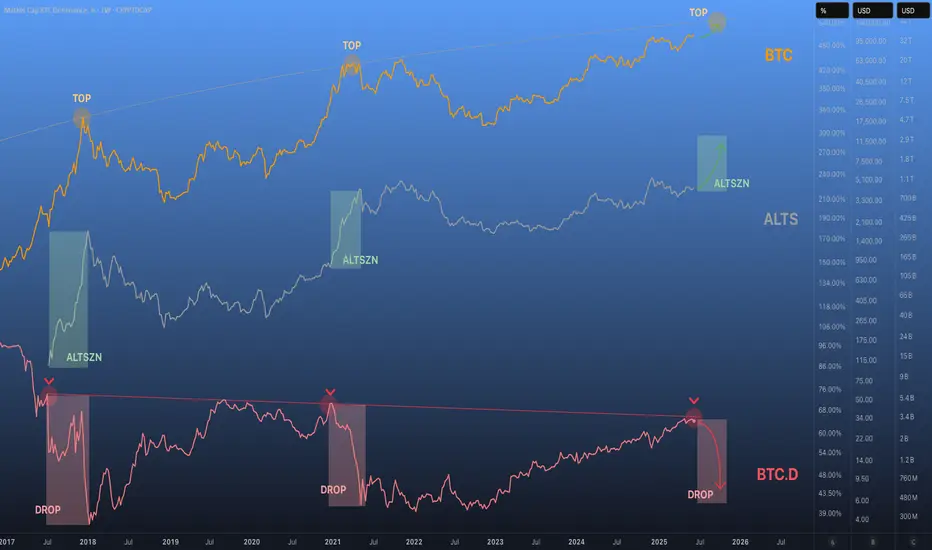
Basically, this is all you need to know about the Altseason🟠 #BTC is like Moses – it always goes first, and the rest simply follow. Due to its significance, Bitcoin attracts the largest investments from the biggest players. That’s why Bitcoin dominance keeps growing for extended periods. 📈
🔴 BTC.D reflects the overall market narrative – from the bottom to the top of Bitcoin’s cycle, its dominance surges. Yes, altcoins usually follow, but they do it slowly (this time they’re lagging even more), simply because most of these tokens are of little interest to governments, major corporations, and institutional players. 🎈
Right now, BTC.D has reached a very critical level — the same kind that sparked previous altcoin rallies. 🔨
⚪️ ALTS – The Total Market Cap of Altcoins only truly explodes when Bitcoin approaches its peak. That’s when the big players start taking profits and rotating their gains into smaller-cap assets (remember the Money Flow concept).
That’s what we call altseason – when MASSIVE capital flows into the market, not your few thousand dollars scattered across a hundred meme coins. 🐸
🤡 Yes, soon enough crypto influencers will be "proven right" after calling for an altseason daily for years, and they’ll start declaring themselves the greatest experts and leaders of the industry. 😂
But remember this – the biggest profits go to those who get in early.
If you’re still sitting around waiting for a “better moment” – then when, if not now, will you take that crucial step forward… before it’s too late? 🐋
BTC.D(based one NEowave)the Z wave of this branch shown as a triangle and I think its finished but for confirmation breaking the 61.9 is important.
its a green light of Altseason.

Bitcoin Dominance Will Drop To 60% SoonGood Morning Trading Family,
I really don't have much to say on this post. My last post on Ethereum showed us an inverse head and shoulders pattern, which plays out over 85% of the time. This is a clear sign that altcoins may rally within the next week or two. And here, on our Bitcoin dominance chart, you can see that the patterns are clear, BTC dom cannot last at this level much longer before a breakdown to 61% or lower occurs. Be prepared. FOMO will get real.
Best,
Stew

Bitcoin Dominance Update – Key Levels in Play!Hey Traders!
If you’re finding value in this analysis, smash that 👍 and hit Follow for high-accuracy trade setups that actually deliver!
BTC Dominance is testing a major resistance zone after a sustained rally from late 2024. The structure is showing signs of exhaustion near the 64-65% zone.
🔶 Pattern: Rising wedge breakdown
🔶 Current Action: Retesting broken support zone as resistance
🔶 Key Resistance: 64.5% - 65%
🔶 Rejection zone: Strong supply sitting overhead
Why this matters for Altcoins:
A rejection from this zone could open the door for capital rotation into altcoins.
BTC dominance stalling = potential for ETH, SOL, and midcaps to gain momentum.
If dominance goes down, it may keep altcoin rallies capped for now.
Monitor closely — dominance breakdowns often align with altseason rotations.
💡 Stay patient, stay prepared.

BTC Dominance – Rising Wedge Breakdown UnfoldingCRYPTOCAP:BTC.D is showing clear signs of weakness as it slips from the rising wedge pattern on the 4-hour timeframe 📉.
The real drama, however, lies on the weekly timeframe, where the same pattern is stretching its limits. A weekly breakdown here could flip the entire script in favor of altcoins 🚀.
Keep an eye on these levels — the market could be hinting at a turning point for the altcoin season! 🌟

BTC.D UPDATEBitcoin dominance potential move. This would be good for altcoins. Unless of course it takes Bitcoin with it

Altseason might be closer than you think...Hello Traders 🐺
I know this chart might look familiar to some of you—but honestly, I have to say this is one of the cleanest and most textbook-perfect setups I've ever seen in my professional career. Everything is lining up so beautifully that it almost feels like it’s straight out of a technical analysis course 📘
Let’s start with the RSI:
As you can see, there's a well-defined descending channel on the RSI. What’s interesting is that this channel is in bearish divergence with the BTC.D chart—and it’s been playing out for 742 days (yes, almost 2 years). That aligns perfectly with the fact that Altcoins, even ETH, have been in a prolonged bear market with no serious breakout yet.
📊
But what does that really mean?
Typically, a bearish divergence like this signals that the dominant trend is losing momentum.
And now, BTC.D is testing a major weekly downtrend resistance (the blue line). Once BTC.D loses its first support, we might see a domino effect, where other key support levels break one after another... leading us right into Altcoin Season 🔥
🔍 Let’s talk levels:
📉
On the daily chart, BTC Dominance is potentially forming a Head & Shoulders pattern.
If it breaks down from the channel, we can expect a strong reaction—especially in large-cap Altcoins.
🧠 When does Altseason end?
Good question—and a tough one.
But here’s my take: It's smart to set profit-taking levels before the euphoria kicks in. When everything is pumping, it gets emotionally hard to hit that sell button 💸
If you want my honest opinion:
When BTC.D reaches around 48%, that’s a solid level to take profits on at least 50% of your alt positions.
Why? Because from that zone, there’s a high chance BTC.D will bounce hard, and that could trigger a brutal Altcoin correction 🩸
I hope you found this idea useful!
And as always, never forget our golden rule:
🐺 Discipline is rarely enjoyable, but almost always profitable. 🐺
🐺 KIU_COIN

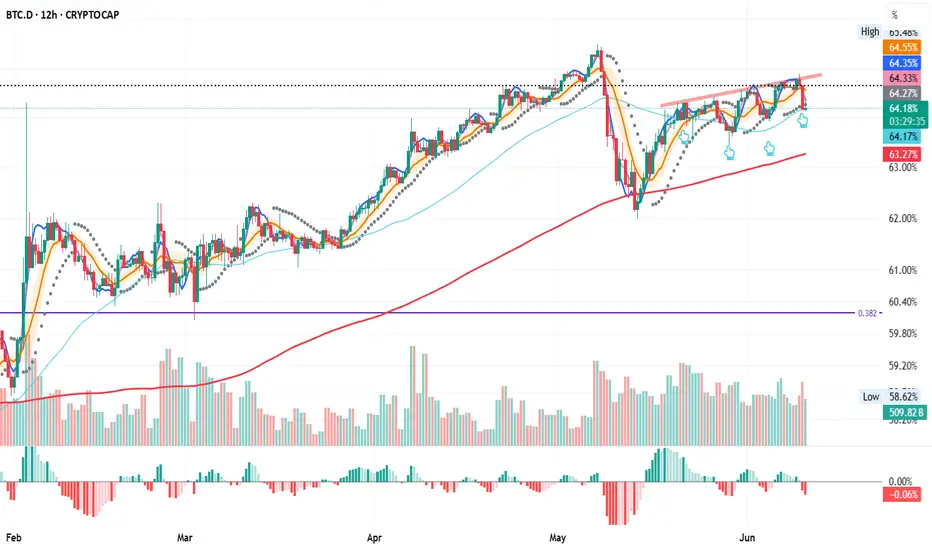
BTC.D – Repeat or Reset?
BTC.D (Bitcoin dominance) on the 12H chart is now testing the 50MA for the fourth time.
The last three touches led to a bounce toward the triple top trendline.
Will it play out the same way again, or will the 200MA need to step in as support?
Let’s watch it unfold together.
BTC dominance : In decline CRYPTOCAP:BTC.D COINBASE:BTCUSD BINANCE:BTCUSDT
BTC dominance did a first big down move , followed by a correction upward.
This correction cames in bearich ascending triangle.
Today , this triangle has been broken.
I expect the dominance to break the 61.9%.
The same pattern is spotted on CRYPTOCAP:USDT.D
As well as the liquidity doen't go back to bank accounts, the altcoins may benefit from this liquidity shift. The final bullish wave on altcoins will continue.
Happy profit taking !

