It looks like BTC.D isn't finished yetBTC.D broke above the golden pocket of its previous down move, and the daily MACD crossed bullish. It looks like another leg up.
BTC.D trade ideas

Altseason Start Fibonacci 0.618, often referred to as the "Golden Ratio", is a key level derived from the Fibonacci sequence. As the numbers in the Fibonacci sequence get larger, the ratio of one number to the next approaches approximately 0.618 (or its inverse, 1.618). This value is known as the Golden Ratio.

BTC.D 2H BTC dominance 2H timeframe:BTC dominance has broken below the rising wedge on the 2H chart — a classic bearish signal.
If it retests the breakdown level and holds, we could see more downside…
And you know what that means — lower BTC dominance usually means altcoins are ready to pump!
🔥 Keep an eye on it!

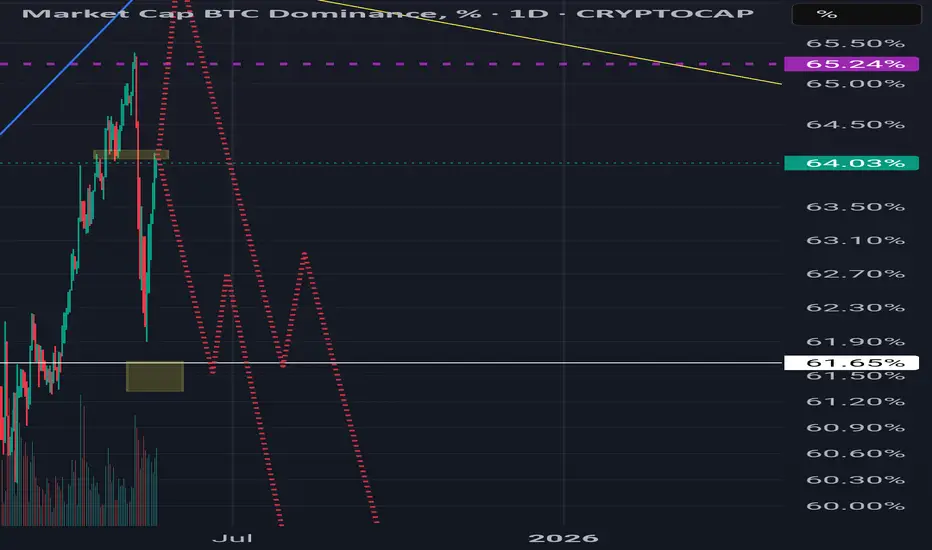
BTC fractals are.. hmm XDWOW! What a great recovery BTC has had over the past few weeks! We see something very interesting happening on BTC Dominance. 2 Fractals with similar momentum and price action have been spotted that match up with the current situation! What we see playing out are 2 VERY different scenarios! Keep your eyes on the 63.7% level and the 65.2% levels for more confidence in which short term direction it will go. #NFA #stayonyourTIPPYTOES

BTC.D PO3BTC.D Is Forming "The Power of 3"
This pattern could signal a shift, potentially paving the way for an altcoin rally once again.

BTC Dominance (BTC.D) looks overextended after a strong run-up.I'm anticipating a small pullback, which could open the door for altcoins to finally gain some momentum. The past few months have mostly favored BTC, but this could be a window where ALTs inject some life back into the market.
Areas I’m eyeing for bids:
Large caps: ETH, SOL, etc.
Mid to small caps: INJ and similar quality projects.
I don’t see meme coins as a solid play just yet — still too much risk without clear rotation.
Macro factors could trigger a BTC.D bounce later, will revisit.

BTC Dominance at Resistance After Structure Shift BTC dominance near its current resistance at 64.15% if breaks can move to next resistance at 65% or final resistance at 71% but at my point of view it's seems unlikely because at 1D time frame BTC dominance change it's character or structure shift and now testing it's Resistance which is also FVG there at 64.15% also we can see it's currently moving in between a channel if breaks which is likely to see it further down to it's next support. If breaks below 62% and BOS again in 1D time frame will give more confidence to confirm recently Market Structure Shift.

$BTC.D : Have we seen the top or a local top in the $BTC.D ? CRYPTOCAP:BTC has been a recent bull run and trying to reclaim the ATH of 107K USD. Currently firmly above 100K the Crypto currency looks very bullish in the near to medium term. But what we have seen is an the CRYPTOCAP:BTC.D chart is having an initial hiccup in this later part of the cycle. For the first time in the last few quarters there has been a back to back 2 weeks where CRYPTOCAP:BTC.D has 2 red candles. CRYPTOCAP:BTC.D reached it local peak of 65.3% which we have closely predicated in this blog space many weeks ago. We said the target for CRYPTOCAP:BTC.D for this cycle is 66%. We came close to 66% and since then we are seeing weakness in the CRYPTOCAP:BTC.D chart.
Now the question comes was that the top in CRYPTOCAP:BTC.D chart ? My take is that this is a local top. We might see some weakness in CRYPTOCAP:BTC.D in the upcoming weeks. Then we will again bounce back to break above the 66% decisively before this cycle comes to an end.
Verdict : CRYPTOCAP:BTC.D achieved a local top. Cycle top taget remains above 66%. Long term bullish on $BTCUSD.

BTC Dominance Forms Symmetrical Triangle Inside Bullish Channel📊 CRYPTOCAP:BTC.D – Dominance Setup Unfolding
🔥 After breaking out cleanly, BTC Dominance is now consolidating within a symmetrical triangle on the 4H chart.
📈 The broader structure remains bullish, with price still respecting an ascending channel — showing strong positioning from BTC holders.
👀 This formation could lead to a decisive breakout. A move here may shift capital flows between BTC and altcoins — stay alert!

BTC.D quick update - May 19 2025he recent drop in BTC dominance accompanied by the drop in USDT.D resulted in stronger pumps in altcoins.
After a temporary upward correction, it looks BTC dominance is ready to continue the downward move. Crossing below the blue trendline can be a good trigger for the drop towards the 62.10%, 60.70% and 59.90% levels.

BTC Dominance 1 of 3 (bearish)BTC Dominance 1 of 3 (bearish)
1. Retraced to fib 0.618
2. Tested (and got rejected) SMA 200
3. Filled the FVG
4. Rejected at premium
5. Entered wave 3 (fib 1.618 target = 58.75%)
6. Fib trend zone 28 May
7. Fib time zone 28 May

Bitcoin DominanceI ask you to tell me what the trend is. Is the number going up or down? There is a gap to 95% BTC.D. This is not debatable. It's a fact. We're about to get a "gap-close", where the ratio attempts to fill the gap. This is very normal, and expected when you properly learn technical analysis and theory. The theory of why the ratio might go for 95%, well before it happens. It's because there's a technical theory behind. You should be paying attention here.

Ascending Channel Update The dominance has been trading writhing this ascending channel since May 2023 (for exactly 2 years) and it still hasn’t broken below this level sustainably. Yes, the dominance just got rejected at the top of the channel, but for alt season to begin, it must break below the ascending channel. The dominance might drop to the support level and bounce, if it bounces it means alts had a run but still not alt season. If dominance breaks below the support level of the channel and stays below the channel, then there’s hope for a sustained alt season and not just a tiny bull run.

No Sign of Weakness YetAs long as Dominance stays above this support level, there is no alt season. Do not be scammed by the scammers who pretend to be traders on trading view. The same scammers have been calling for alt season by misleading people through BTC.D charts. Yes, the D dropped by 5%, but it recovered very quickly and there will be non alt season unless the D breaks below the major support shown in the chart. Don’t let them mislead you. Weekly RSI is showing a divergence, which means there might be a reversal in the near future, but RSI alone is not reliable enough and so far despite the divergence on the RSI, the D keeps rising and the Alts keep bleeding.


Bitcoin Dominance Is Growing, But Don't Panic!Hello, Skyrexians!
When I shared last update on CRYPTOCAP:BTC.D I mentioned that not sure that altseason has been started, now I decided to go back to my first scenario where dominance shall reach 67%.
You can tell me that wave 4 shall be ABC shaped and now we will see dump to 61%, but dominance usually has the very sharp corrections, moreover 0.38 Fibonacci has been reached and Awesome Oscillator crossed zero line on 2 days time frame. Wave 4 is likely to be finished. Now wave 5 is going to the most likely target at 67%. This pump will be fast, may be in 1-2 weeks. Also wanna tell about disaster max target at 72%. This target is very very unlikely because it will break all picture on 1 week time frame, but also let's just keep in mind. This analysis perfectly correlates with ATOM analysis, which is also actual for all altcoins.
Best regards,
Ivan Skyrexio
___________________________________________________________
Please, boost this article and subscribe our page if you like analysis!

BTC DOMINANCE NEW UPDATE (1D)This analysis is an update of the analysis you see in the "Related publications" section
This upward move is in line with our previous plan and is meant to complete wave G.
Wave F didn’t touch the green zone exactly and reversed slightly higher due to market maker manipulations, which has made trading in these areas more difficult.
It is expected that from near the top, the price will drop to complete the larger wave F | which might come with a green and attractive market. Completing wave G, which we are currently in, will likely take several more days.
For risk management, please don't forget stop loss and capital management
Comment if you have any questions
Thank You

Dominance is currently engaged in a battle to move downward.Bitcoin dominance is currently in a strong downward battle, facing increasing pressure from altcoins which are gaining momentum. Despite some resistance trying to push dominance higher, the overall trend suggests a weakening grip of Bitcoin over the crypto market. This decline indicates growing investor interest in alternative cryptocurrencies, especially as sector-specific tokens and new projects start to outperform BTC. If this downward movement continues and breaks key support levels, we could see a more significant rotation into altcoins, fueling a broader rally across the market.

BTC Dominance – Critical Breakdown ConfirmedBitcoin Dominance has officially broken below the long-standing rising wedge structure, signaling a significant shift in market momentum. This pattern, which had held strong since December 2024, has now failed — and that’s a big deal.
After the breakdown, BTC.D temporarily bounced but was rejected on the retest of the wedge’s lower boundary, confirming the breakdown as valid. This retest-then-drop scenario is a textbook bearish continuation signal.
Not only did BTC.D lose the rising trendline, but it also failed to hold the horizontal support zone near 63%–62%, which acted as a key floor for months. Now, with price heading lower, Bitcoin's dominance is clearly weakening, and that’s bullish for altcoins.
What this means:
Bitcoin is losing control of market share.
Altcoins may start gaining serious traction, especially mid and low caps.
If BTC.D drops below 60%, we could see an acceleration of capital rotation into altcoins — a classic start to an altseason.

BTC.D SHORT IDEABTC dominance shows bearish pattern+small bearish pattern. I'm expecting alt season.

BTC.DBTC.D
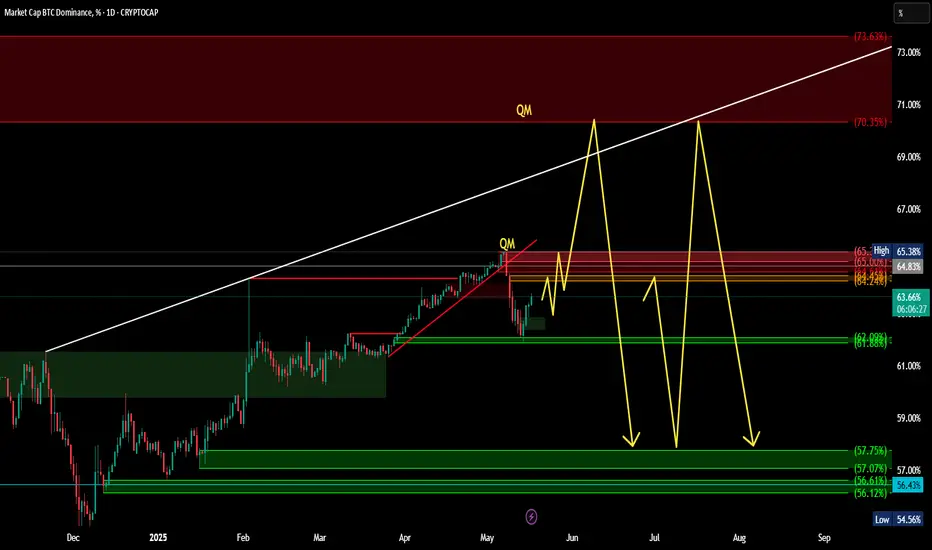
The chart is in an uptrend and had a correction.. ERC bearish candles which indicate a head and shoulders
Ahead targets 64.21 or 64.51 or 65
If the correction starts from this area it is a sign of alt season and can be up to the support area of 57.75
If it does not correct from this area it can be from the resistance area of head and shoulders 75.35 which is a sign of alt season and can be up to the support area of 57.75
So, where do we go from here?I assume the daily timeframe will determine the direction in which BTC.D is heading. Either we're making a lower high, which would suggest that BTC.D has reached its top, or we're making another higher low, which would suggest that BTC.D is heading higher again.
