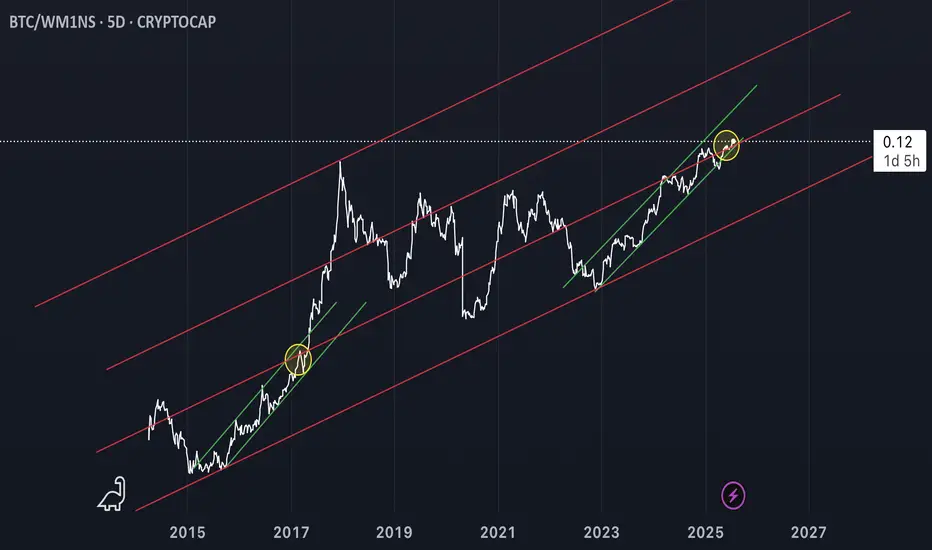
Bitcoin now on 2017 supportNot a chart I’ve shared before. Previous historical resistance in 2017, is now support. (BITCOIN divided by M1. BTC/WM1NS)
BTC trade ideas
The Final Turn Before the Altcoin RotationAs Bitcoin continued its rise, altcoins couldn't keep up. This isn't the first time; the market has experienced this many times. The general pattern is as follows:
1. Global liquidity increases, providing a kind of spark to the market.
2. Bitcoin catches fire, and a bull market begins. If global liquidity increases during this time, great.
3. For various reasons, altcoins don't rise at the same pace as Bitcoin, and therefore Bitcoin's dominance begins to gradually increase.
4. When the market reaches saturation, dominance declines, leading to a rotation into altcoins.
5. The altcoin market capitalization equals Bitcoin's, and the bull market begins.
We're currently at a stage where Bitcoin's dominance has peaked and liquidity is still rising. The beginning of a decline in dominance will trigger a market rotation. This will trigger a capital flow into altcoins, bringing their market value equal to Bitcoin's.
Therefore, we're at the final plateau before entering a bull market. A further rise or hold in Bitcoin is expected. I'm currently buying altcoins, but I'm holding Bitcoin. I don't have a sell mindset at the moment.
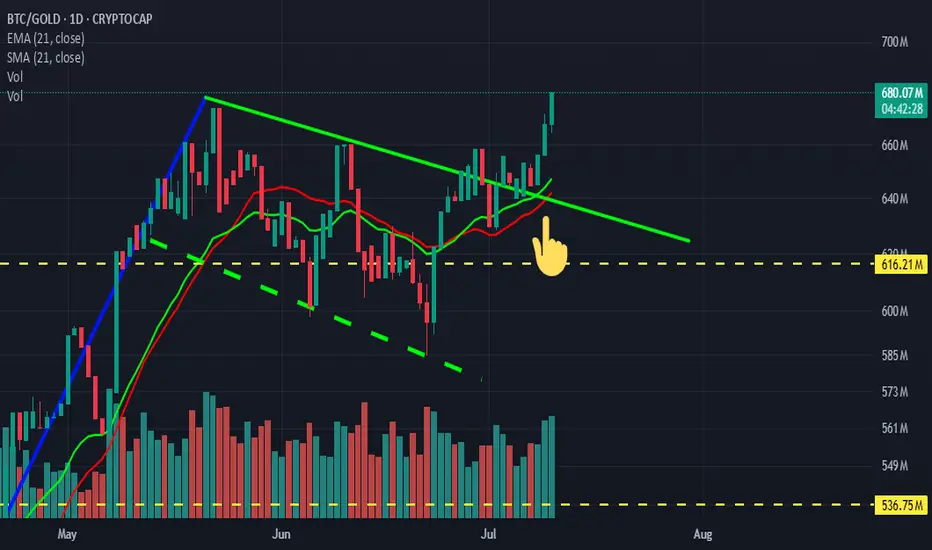
Bitcoin Breaking out against goldLooks like the sentiments from the Crypto Tariff meeting were positive,
Bitcoin breaking out against gold, 3 green candle pump of the 21day.
xD
Waves*Standard deviation extensions from the completed waves (blue)
Expecting a 1-1 harmonic move higher here (pink). Not much else to say about this idea, other than the potential for other waves to happen that could invalidate this wave count but thats always a possibility.
The current count is all textbook EW wave counts for the sub-waves, but my own extended wave structure for the major fractal (largest 5 wave sequence).

BTC VS M2 Total Valuation at alltime high supportanother way to look at the macro picture
BTC claiming an all time high ratio of monetary supply
I wonder if anyone else pays attention to this? idk worked for the bottom

BITCOIN market cap 5 waves up ENDING NOWSo the chart posted is Bitcoin market cap which matches the same wave count in the Bitcoin I have moved to a full short BITCOIN look for a rather big abc down back to .618 best of trades WAVETIMER

REANALYZING BTC Like mentioned in my previous share, this is the reanalysis.
BTC still hold a very strong bullish trend. With it being an appreciative asset, every bearish trend is wisely considered a retracement. The recently broken trend is characterized by multiple weaknesses.
With the fact that it respected the 50% retracement level to break the bearish trend + the bullish strength, gives the bulls an upper hand.

BTC Dominance + Stables approaching key resistance BTC Dominance + Stables approaching key resistance (72–76%) — historically a top signal before altseason rotations.
1️⃣ Dominance nearing peak
The BTC dominance index (including stables) is pushing into the historically critical zone.
Past peaks in this area have often marked local BTC tops followed by altcoin rallies.
2️⃣ Why it matters
When BTC.D + stables stalls at the top, it often signals that capital is ready to rotate into altcoins.
A final BTC push without alt response = classic trap before liquidity flows into riskier assets.
3️⃣ What’s the plan?
🎯 If BTC.D spikes into 75–76%, we’ll begin aggressively accumulating altcoins.
Key confirmation = BTC stalling & dominance reversal.
Until then: observe and let the market come to you.
Final thought:
Altseason doesn’t start with hype — it starts with rotations.
Watch the dominance chart closely. The setup is forming.

Trading Crypto Currencies using the stock market derivatives.There are now over 40 Bitcoin ETFs that you can use for long term investing, trading for monthly income, to diversify, to mitigate risk, or for safe-haven investments. BTCs are a Stock Market Derivative. There are numerous derivatives that are available in the stock market. Every other financial market has derivatives that have been developed by Dark Pool Buy Side Institutions as well as Derivative Developers.
The stock market is the safest and easiest of all the financial markets to trade. It is simple to learn the market participant groups a who is leading price up or down.
The stock market provides everything you need in the most straight forward and simple buy or sell format.
There are 8 financial markets which now includes crypto currencies in the US financial markets. The Buy Side Giants have been accumulating Bitcoin for several years now, as they recognize the potential of crypto to help investors and traders diversify or have another type of trading instrument they can use for monthly income.

Squawk! Bitcoin Longer, Larger, and Exponentially Growing Cycle!Squawk! Bitcoin Longer, Larger, and Exponentially Growing Cycle!
Bitcoins market cycle is expanding, lasting longer than most anticipate! As price channels widen over time, the scale of each move grows exponentially, extending both the peaks and the troughs! It’s Squawktasticly bigger!

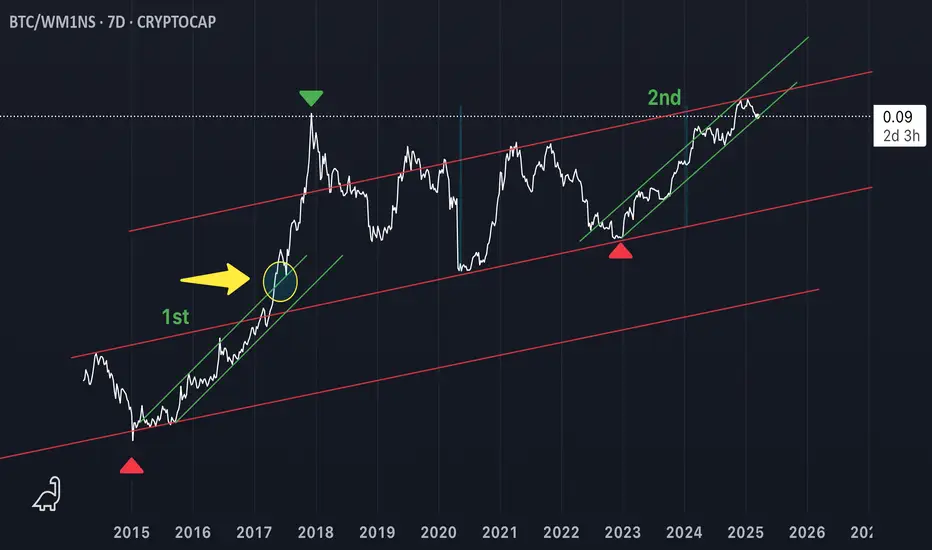
Where is Bitcoin?Squawk! Currently Bitcoin is at the 2nd yellow arrow! Compare to the first arrow for the roadmap my Squawky friends!
Bitcoin Market Cap Breakout Potential | Bullish SetupThis 1-hour chart for the Bitcoin market cap ( CRYPTOCAP:BTC ) suggests a potential bullish breakout.
🔹 Major Support: The price recently tested and respected a strong support zone, indicating buyers are stepping in.
🔹 Triangle Formation: A symmetrical triangle is forming, which typically leads to a breakout.
🔹 Weak High & ATH Target: If the breakout occurs, the market cap could push past previous highs, targeting the 1.88T level and beyond.
🔹 Bullish Scenario: A successful breakout above the triangle’s resistance may trigger an uptrend towards the weak high, followed by an attempt to reach new all-time highs (ATH).
💡 Key Levels to Watch:
Support: 1.65T
Breakout Confirmation: 1.66T+
Target: 1.88T
This setup suggests a bullish continuation, but a failed breakout could lead to a retest of support. Keep an eye on volume and momentum for confirmation.
What are your thoughts? Will BTC market cap break out soon? 🚀📈
#Bitcoin #BTC #Crypto #Trading #TechnicalAnalysis

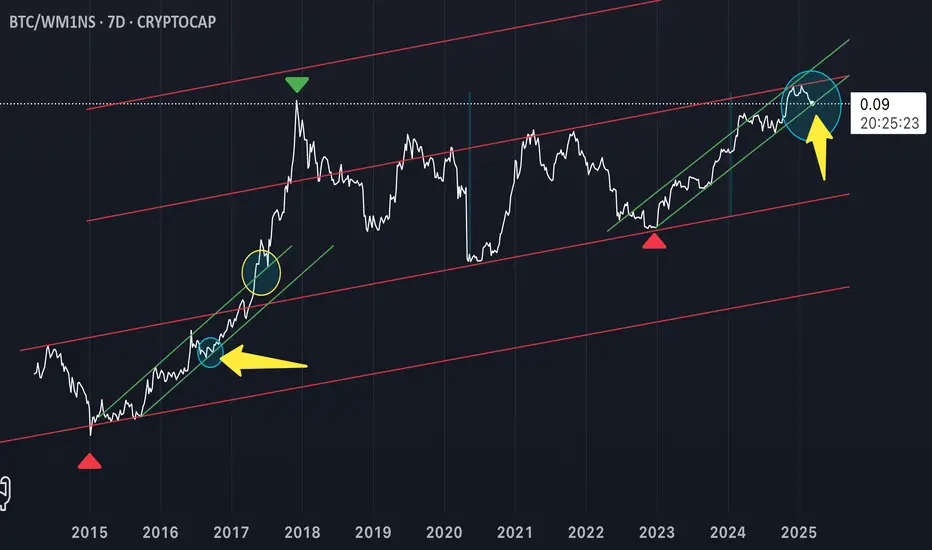
Bitcoin Green Channel Are Telling!Waiting for Bitcoin to meaningfully breakout up through this 2nd green channel and confirm, followed by a steeper angle of attack move up! BTC/ WM1NS 7 Day Chart.
Bitcoin green channels are telling!Waiting for Bitcoin to breakout from the 2nd green channel and confirm meaningfully off of this channel top, higher at a steeper angle of attack! BTC/WM1NS 7 Day Chart

Sailing27db97e52ec7b1b43e5391bb5861b8d4cf37d3a7c3a1a06d3aa0533382d52733
Bitcoin's conservative addressable share of speculative assets is 2%.
The total market cap of the speculative portion of assets are as follows:
Real Estate: $2.14 trillion
Gold: $7.83 trillion
Silver: $108 billion (0.108 trillion)
Stock Market: $21.8 - $32.7 trillion (We'll consider the lower and upper estimates)
Bonds: $7.035 - $14.07 trillion
Total speculative market cap: $38.913 trillion to $56.848 trillion.
Conservative estimate for Bitcoin's share of this is 2%, or 0.778T-1.137T
The conservative multiplier for Bitcoin, is 118x. This means that for every $1 invested in Bitcoin, the market cap tends to increase by $118. Let's assume 10x instead.
0.778T-1.137T X 10 = 7.783T - 11.370T
Conservative projected price range 350k-666k
Market Cap details below:
Real Estate:
* Total Market Cap: $379.7 trillion
* Speculative Portion Market Cap: $2.14 trillion (Investment real estate)
* Speculative Portion: 0.56%
Gold:
* Total Market Cap: $19.57 trillion
* Speculative Portion Market Cap: $7.83 trillion
* Speculative Portion: 40%
Silver:
* Total Market Cap: $1.816 trillion
* Speculative Portion Market Cap: $108 billion
* Speculative Portion: 5.95%
Stock Market:
* Total Market Cap: $109 trillion
* Speculative Portion Market Cap: $21.8 - $32.7 trillion
* Speculative Portion: 20-30%
Bonds:
* Total Market Cap: $140.7 trillion
* Speculative Portion Market Cap: $7.035 - $14.07 trillion
* Speculative Portion: 5-10%

Bitcoin Distribution PhaseThe safety trade appears to be unraveling, with Bitcoin showing clear signs of topping out as it moves through a distribution phase. Chart analysis supports this, and the narrative among Bitcoiners has shifted following President Trump’s emphasis on supporting all digital assets and U.S. companies, rather than positioning BTC as a strategic reserve.
This marks a pivotal shift in market sentiment. Many had hoped for Bitcoin to play a central role, but the focus on a broader digital asset ecosystem has left some investors disappointed. While this may take time to fully digest, I believe this narrative, combined with technical indicators flashing bearish signals, sets the stage for a rotation out of BTC and into altcoins.
Altcoin momentum could gain further traction as investors seek opportunities in projects aligned with a more diversified digital future. As we continue monitoring price action, this could be the catalyst the market has been building toward.

TRUMP PUMP? MORE LIKE TRUMP DUMP!!! WHERE DOES BITCOIN STOP?Bitcoin is losing support and on these higher timeframes it looks rough as a dogs bum.
Will the pain stop?Yes, but it will be shortlived, it will give bulls enough hope to fomo back into longs before crushing their souls and their pensions.
Good luck.

Bitcoin Market Cap PitchForksCRYPTOCAP:BTC
Setup PitchForks for each cycle, starting at the low. Looks to be good high touchpoints and trendlines to follow. Interested to see this current PitchFork have more touchpoints and then move back into the 2021 PitchFork at high valuations, entering the 2021 PitchFork around 4 to 5 Trillion in Market Cap.
COINBASE:BTCUSD CRYPTOCAP:BTC

A Hopefullly Less Deluded ForecastJudging by how the market has been moving, if buyers aren't showing up soon the price is likely going to be pushed into the 1D ichi cloud where we could see a quick drop from current levels to 86 once shorts start looking safer. Maybe some suppression again if the price tries to break into 91-93 in an attempt to push even lower and maybe wick into 80-82k where the cloud stops.
If market stays bullish like its been it could be ATH again from there, although if sentiment shifts considerably by the time it reaches 86-88, I'm sure plenty of big newcomers who want it cheaper are aware there just is not much of any support or price discovery between 86 and 77. If the large cap alts do another big massive dump when BTC breaks below 91, it might be good to watch carefully at 86k before jumping on a big long.
Very speculatively thinking, if 91k keeps holding up my best guess is we will see sideways for a much longer time... maybe a week or more. Something perhaps like a shallow cup that bottoms around 89k and then breakout only after 100k or so.

BTC/SPX - trend is upThe chart speaks for itself, we are clearly in a channel. The trend is up. How it goes, no idea, but it is a matter of time.

BTC MARKET CAP SHORT PRESPECTIVE
Observations:
1. Head and Shoulders Pattern:
- There seems to be a potential "Head and Shoulders" pattern forming near the top of the recent trend, which is often considered a bearish reversal signal.
2. Fair Value Gaps (FVG):
- Two Fair Value Gaps are marked on the chart as potential zones where the price may gravitate toward.
- The upper FVG is closer to the $1.68T market cap level.
- The lower FVG is around $1.4T–$1.5T.
3. Volume:
- Volume has been declining slightly as the market cap approaches the top, which might suggest waning buying pressure.
4. RSI Divergence:
- The RSI indicator at the bottom shows a potential bearish divergence where price makes higher highs, but RSI fails to do so. This is another sign of a possible upcoming correction.
5. Support and Moving Averages:
- Price is currently above the major moving averages, but a correction could lead it back toward the lower FVG or moving averages for support.
6. Trendlines:
- A breakout from the wedge or channel earlier in the year led to the strong bullish rally. Now, a consolidation and potential reversal pattern is forming.
Analysis:
- The current chart suggests a possibility of a pullback or correction in the near term if the head-and-shoulders pattern confirms.
- The first target for this correction could be the upper FVG at $1.68T, with further downside potential to $1.4T–$1.5T (lower FVG).
- If the market fails to hold support at these levels, it may signal a more significant bearish trend.
Key Levels to Watch:
1. Support Zones:
- $1.68T (upper FVG).
- $1.4T–$1.5T (lower FVG).
2. Resistance:
- If the market cap manages to invalidate the head-and-shoulders pattern, a breakout above $2T could lead to new highs.
Conclusion:
Monitor the key support levels and the confirmation of the head-and-shoulders pattern. A breakdown below the neckline would signal a stronger bearish move. However, if support holds, it could resume its bullish trend.

250k Btc (with facts) Bitcoin growth across three Halving CyclesFirst Halving:
Market cap at halving: 146 million
Market cap during run-up: $18.75 billion
Run-up: 20 billion (approx.)
Second Halving:
Market cap at halving: $9.375 billion
Market cap during run-up: $300 billion
Run-up: $290.625 billion (approx., 15 times larger than the first halving)
Third Halving (hypothetical):
Market cap at halving: 150 billion
Possible market cap scenarios during run-up:
a. $1.2 trillion (already achieved)
b. $2.4 trillion (potential)
c. $4.8 trillion (potential)
Run-up (applying the 15x increase pattern): $4.35 trillion approx.
Hope you learned something :)
Follow for more

forecast for btcWith the breakout of the ascending trend line on the RSI, we expect the Bitcoin price to correct to the Fibonacci level of 0.618 (79800 $)
