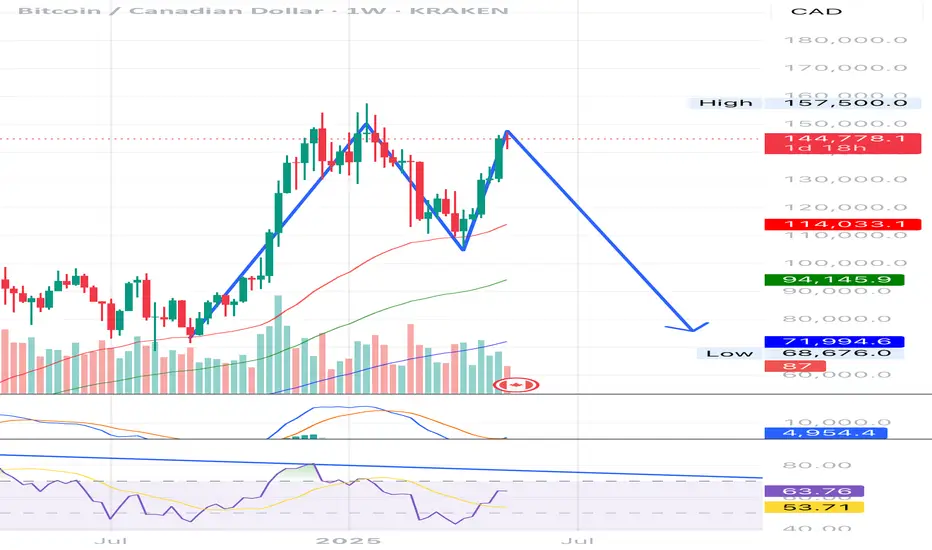
Bearish move coming in BTCCAD?Double top pattern may be formed in BTCCAD.
It’s a possibility that 3rd time rejection from RSI resistance may happen and form double top pattern. Would wait for 2-3 weeks more for a better signal.
Related pairs
Bitcoin doing a retest ! As advised earlier,
BTC is doing a retest of its breakout. Once it reaches between 105-110k CAD, it will go up again. Add between these levels.
It has also adjusted the highly inflated RSI.

Bitcoin to correct 18-20%Bitcoin has risen after its breakout from the trendline owing to a C&H pattern, however after every breakout comes a retest which hasnt been done in btc till now.
In my opinion we can see a selling rally till around 105k CAD.

BTC Bullish Trend Weekly BTC-CAD Chart.
Clear breakout of C&H Pattern done, Current RSI at 77, resistance of around 85 levels. Approx 145,000 levels. Profit booking can be done at these levels, gap filling can be done.


See how BTC heads towards all of my lines my intersecting lines I think I've come up with a way to follow BTC and other coins with my lines and TR Main

I use lines to find the sweet spots in the chartFinds the sweet spots in movement and heads towards them.

Til TR Main Hybrid System works for me, I don't work for it. That Man's a great Teacher. You should listen. Astutely

Follow my chart and if it works I will say how I chart with lineFollow my chart and if it works I will say how I chart with lines and TR Main Hybrid System. Showing is better for me. I am not a good explainer.

Trend line analysis - Weekly Trend line analysis - Weekly Timeframe
These curves & triangles highlight support/resistance zones on a weekly timeframe. Fairly conventional methods used. RSI & MACD incidators aswell. There are two triangles highlighting the possible RSI outcome if the support/resistance zones hold out.
I believ

See all ideas
Summarizing what the indicators are suggesting.
Oscillators
Neutral
SellBuy
Strong sellStrong buy
Strong sellSellNeutralBuyStrong buy
Oscillators
Neutral
SellBuy
Strong sellStrong buy
Strong sellSellNeutralBuyStrong buy
Summary
Neutral
SellBuy
Strong sellStrong buy
Strong sellSellNeutralBuyStrong buy
Summary
Neutral
SellBuy
Strong sellStrong buy
Strong sellSellNeutralBuyStrong buy
Summary
Neutral
SellBuy
Strong sellStrong buy
Strong sellSellNeutralBuyStrong buy
Moving Averages
Neutral
SellBuy
Strong sellStrong buy
Strong sellSellNeutralBuyStrong buy
Moving Averages
Neutral
SellBuy
Strong sellStrong buy
Strong sellSellNeutralBuyStrong buy
Displays a symbol's price movements over previous years to identify recurring trends.