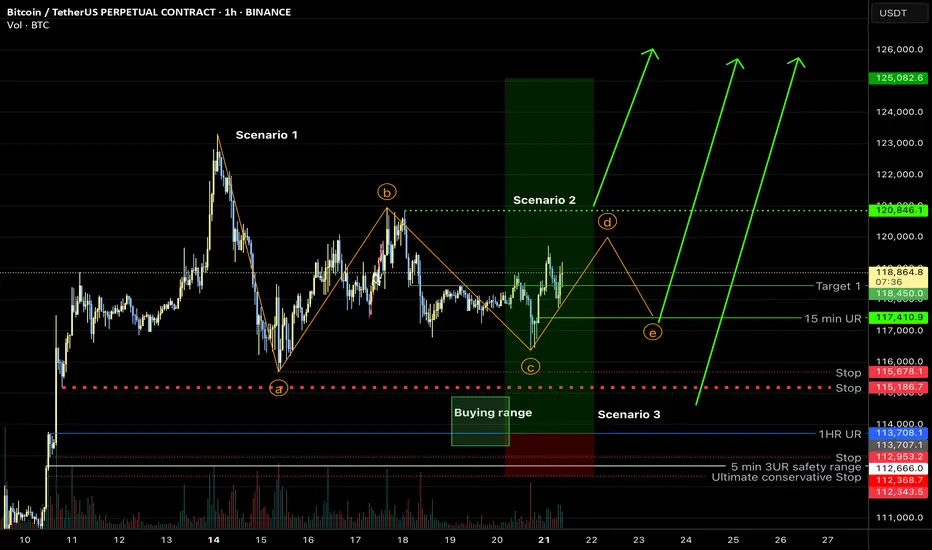
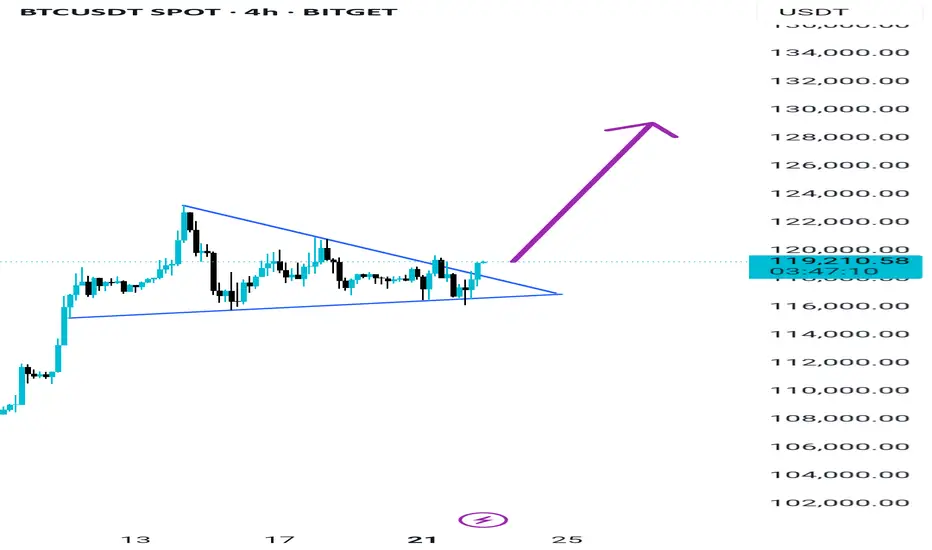
Bitcoin overall: sideways range, new ATH soonMy previous hypothesis of a sharp correction (scenario 3) looks to be incorrect. I believe the most likely corrective structure is a contracting triangle at this point (scenario 1), and the last leg should be bought for new ATH, however, it is also possible we had the last major low for this correction and new ATH are imminent (scenario 2)—which will be on the table if the indicated line gets taken out. In any case, new ATH should occur shortly!
BTCDOWNUSDT trade ideas
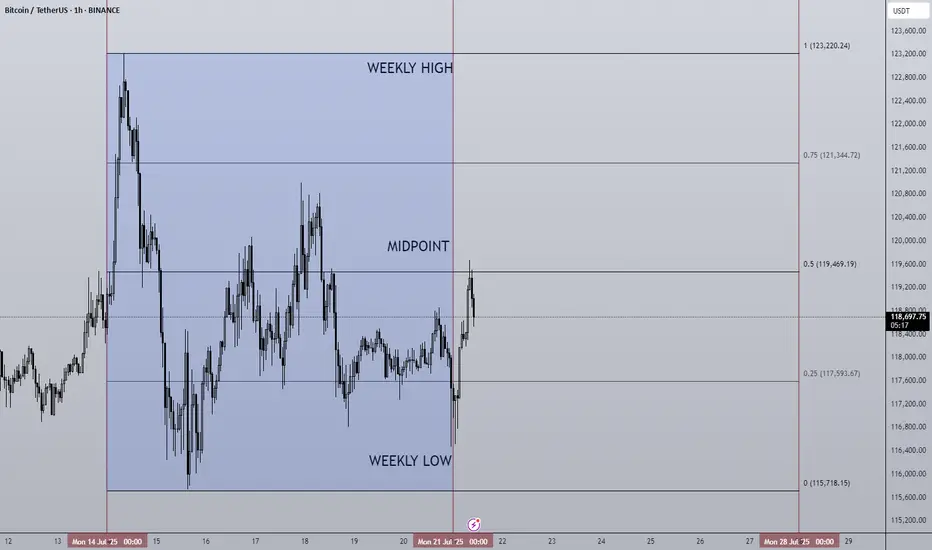
21/07/25 Weekly OutlookLast weeks high: $123,220.24
Last weeks low: $115,718.15
Midpoint: $119,469.19
New BTC ($123,220) & SPX ($6,315) ATH last week! We're really seeing progress being made on all fronts now, bitcoin saw its sixth week of net inflows into BTC ETFs ($2.39B).
The week began strong hitting the new ATH very early and then settled into a tight range to cool off. Altcoins however surged in relation to BTC to break out of HTF downtrends and begin to make up lost ground. One of the beneficiary's of this price movement has been ETH, breaking out from a multi year downtrend against BTC and hitting $3,800 in its USD pair.
For this week I do expect much of the same for BTC as momentum is with altcoins for now. However, as those altcoins reach HTF resistance levels it becomes very important for Bitcoins chop to be accumulation for the next leg up and not distribution for the way down. With so few pullbacks the threat of a sudden correction is present but the probability drops should BTC look to press higher with strong demand.
The ECB Interest rate decision takes place on Thursday but no changes to the 2.15% rate is forecast. In terms of news there are no planned upsets that I can see.
Good luck this week everybody!

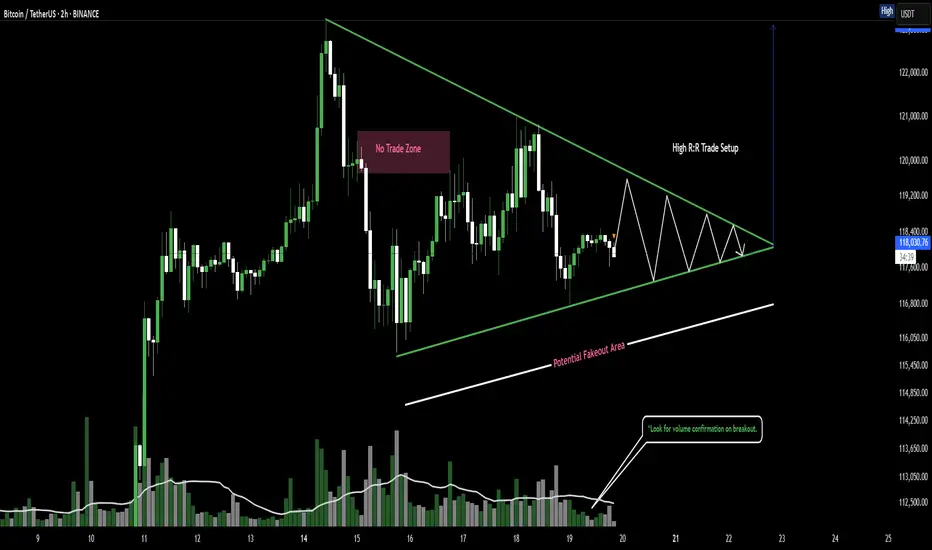
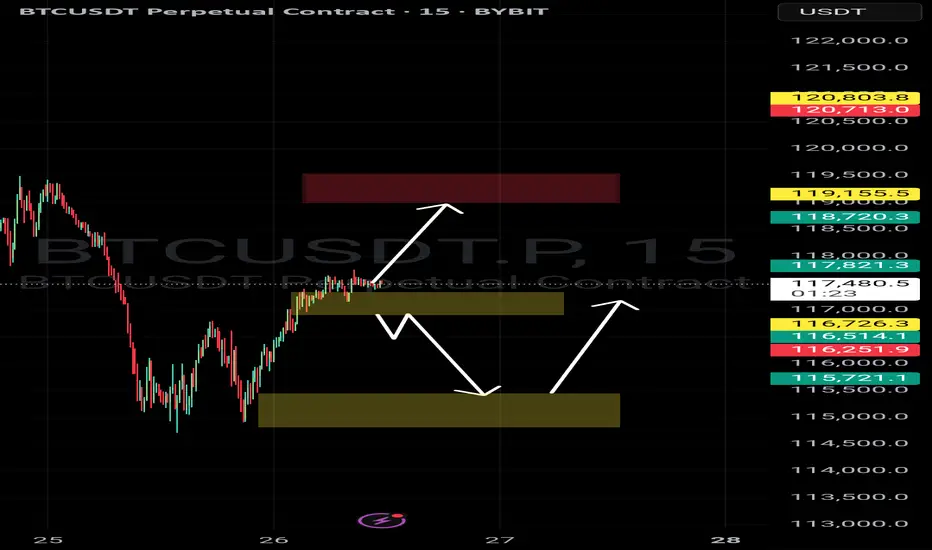
Bitcoin Technical Outlook -2HA symmetrical triangle is forming with declining volume — signaling a likely breakout.
🔼 Break above ~$119.5K → Target: $123K
🔽 Break below ~$116K → Target: $113.5K
⚠️ Await confirmation before entering. Risk management is key.
Bitcoin (BTC/USDT) Technical Outlook – 2H Chart
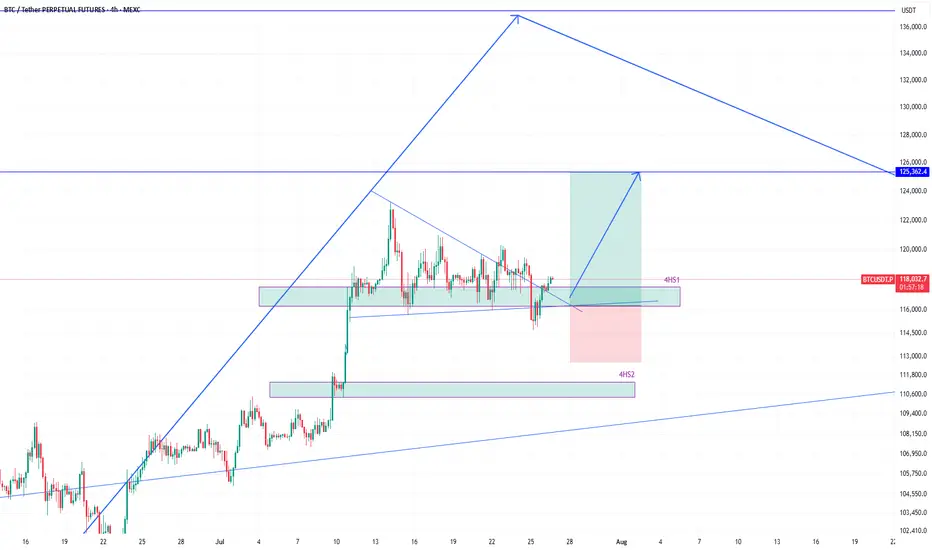
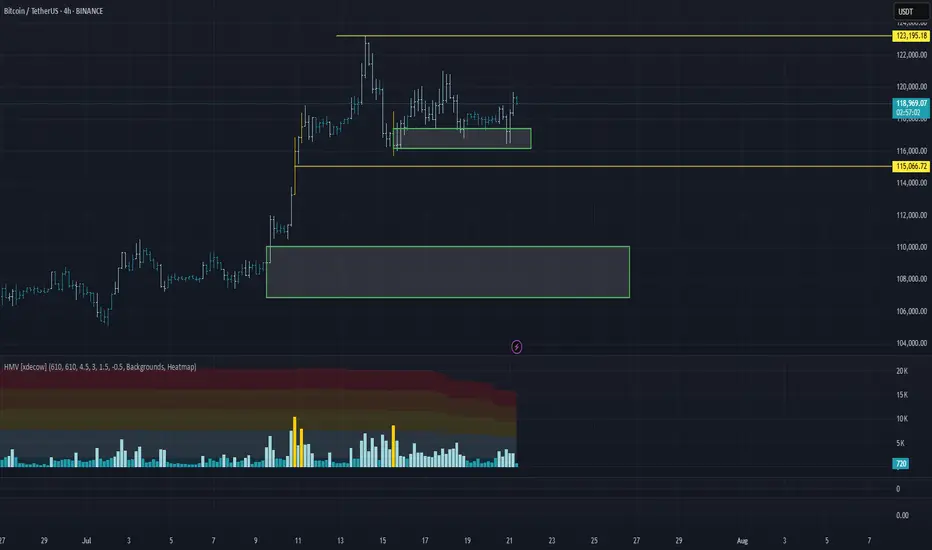
BTCUSDT eyeing 125k next after bounce from 116k zoneEarlier I shared the high time frame view of #BTCUSDT. We know that its heading higher and that helps in holding spot positions.
However, the move to the high frame target will not happen in a straight line, instead with various push to the upside and then subsequent corrections to the down side.
Therefore, as a trader, we must profit from those movements as we see some good high probability setups.
And there is one right now which is a long position.
The price broke 4h support 4HS1, but quickly reclaimed it. That is a sign of demand and strength required to move higher.
Therefore, this presents a long opportunity where the target of this long position should be 125k.
As the price enters into 4HS1 zone, I will scale into long position.
It is quite likely that the price will bounce hard once it taps into 4HS1 zone.
I am talking this long position targeting 125k. What about you? Share with me what you think.
BTC NEXT MOVE UPWARS OR BREAKDOWN?We can see btc hovering over bullish ob
We can expect a pump from here
If breakdown both bullish ob we can look for shorts
Indicator used tuffycalls smc orderblock
BTC /USDT : Getting support from FVG BTC Support from FVG - Bullish & Bearish Scenarios:
Bullish Scenario:
BTC is holding support from the FVG. As long as BTC stays above this zone, the market remains bullish. A bounce here could lead to further upside.
Bearish Scenario:
If BTC breaks below the FVG, it signals a potential downtrend. A breakdown may lead to more pain and further declines in the market.
Tips:
1. Wait for Confirmation: Look for a clear candle close above/below FVG for validation.
2. Risk Management: Set stops near the FVG to manage potential losses.
3. Monitor Volume: Strong volume during support retests increases bullish potential.
4. Stay Flexible: Be prepared for a market shift if BTC breaks the FVG support.
BTC dropping like a brick....bound to happen sooner or laterHard drops follow big spikes. Happens every time, just look back in time. But this time it's different? Maybe to some extent, but as long as there are short term profit takers and insane volatility this trend will continue. Only 2 cents is to not SHORT SELL. You will only contribute to the potential squeeze and will lose money. If you're up now, your priority should be to retain value and sell before it goes down to it's next support level which is under 100k! Maybe it does or not, but the dips do happen and with automated trading bots it could hit more aggressively and faster. If anything, but the dip when there's sufficient support. Best of luck!

BTC / USDT : Broke down and now going for retestBitcoin Analysis:
Bitcoin has broken down and is now retesting the support zone. As mentioned earlier, a shakeout can happen at any time, and this looks like the potential retest phase.
Bullish Scenario:
Reclaims Resistance: If BTC manages to break through the resistance after the retest, it will stabilize for the short term. This could lead to a move towards higher levels.
Bearish Scenario:
Failure to Break Resistance: If the retest fails and BTC can't reclaim the resistance, further downside could be expected.
Targets: Keep an eye on the CME gap at $114,000 and 92K as key levels to watch for potential price action.
Note:
Manage your risk carefully. The market is volatile, and a shakeout could happen anytime. If BTC fails to break resistance after retest, more pain may be ahead.

BTC - RotationsStill pingponging between VAL and VAH, so there is not much to update on BTC.
I think patience is key here, most of all don't chase moves but position at the extremes for opposite side, then you are much better placed for continuation moves.
I never try to have much expectations, but there is a smol gut feeling that ETH puts in a new high locally (let's say around 3920-50) while BTC takes out the internal highs at 121k and makes a lower high.
I can be wrong and we simply keep drifting higher, but divergences between ETH and BTC are often worth watching, because the market as a whole usually struggles to maintain strength when alts attract more capital than BTC does (relative to mc).
Crypto Market Update & BTC & ETH Analysis
🚀 Crypto Market Update & Technical Analysis
🟢 Bullish News & Positive Signals:
• Altcoin Season Index is rising + CZ calls this the “FOMO season” → signaling emotional growth in altcoins, especially in short timeframes.
• Fear & Greed Index hits 74 → market is in a greedy phase; growth continues but a correction might be near.
• Goldman Sachs: Possible rate cuts from 2025 → expectations for a looser monetary policy, which is good for risk assets like BTC and ETH.
• Whales and institutions buying ETH (over 50K ETH in 48 hours) → suggests accumulation or preparation for the next Ethereum rally.
• $332M inflow into U.S. Ethereum ETFs → strong mid-term bullish fundamental for ETH.
• A whale withdrew 76,000 SOL from exchanges → usually a sign of HODLing and price growth expectations.
🔴 Warning News & Caution Signals:
• Bitcoin selling by long-term holders (high CDD) → selling pressure near historical highs could slow the rally, but not end it.
• Whale opened a 10x leveraged DOGE long ($19.82M) → could cause high volatility and liquidation risk for traders.
• TRON rings Nasdaq bell but TRX is negative → promotional event, but no strong demand reaction.
• BNB market cap surpasses Starbucks, but price is negative → long-term positive, but short-term market may be overheated.
• High Greed Index → short-term correction risk for BTC and alts.
✅ Analytical Summary (News + Charts):
• If technical signs of selling appear (especially on BTC or ETH), take them seriously as news supports selling pressure from some whales.
• Big institutional entries into ETH and SOL confirm the strength of the bigger trend.
• Market is emotional but still has a strong support base under BTC & ETH. Possible corrections = better buying opportunities, not exit signals.
📊 Technical Analysis
Strategy I use:
I analyze HWC (1D), MWC (4H), and LWC (1H).
Entry is based on breakouts in MWC (4H) and confirmation in LWC (1H).
♦️BTC/USDT♦️
• BTC is moving in the 116.2 – 120 range, keeping a bullish structure intact.
• I will not look for shorts as long as 110 holds.
• To keep the bullish scenario alive, we need high volume and sharp candles to break 121 – slow moves won’t work anymore.
• Stop-buy orders near 121 can be used to enter a long if the breakout is strong.
♦️BTC Dominance (BTC.D)♦️
• After a sharp drop last week, BTC.D is now correcting.
• Key level 61.31 was broken.
• The next resistance zones are 62.17 – 62.74 (currently being tested).
• If BTC.D holds above these levels, altcoins could see a bigger drop.
• If BTC.D rejects this zone, alts near breakout points will become our focus with better entry levels.
♦️USDT Dominance (USDT.D)♦️
• Showing signs of forming a bullish structure.
• Next resistance levels: 4.36 – 4.44.
• For a bullish continuation in coins, 4.14 must break down.
• Early but important level: 3.83 – if reached, we must rethink position management.
TOTAL / TOTAL2 / TOTAL3 /♦️ ♦️OTHERS.D
• Currently bearish, but BTC.D and USDT.D will show earlier signs of whether the correction is ending.
• Key levels to watch:
• TOTAL: 3.91
• TOTAL2: 1.55
• TOTAL3: 1.08
• OTHERS.D: 8.05 (a lower high may form if the uptrend resumes).
♦️ETH/BTC♦️
• Key level: 0.02975 (not reached yet).
♦️ETH/USDT♦️
• 3470 is the crucial level to keep the bullish structure.
• Many buyer orders (maker/taker) are stacked here, so the breakout may not be easy.
• Possible fake breakout in this area → could reset the bullish scenario again.
🎯 Conclusion:
The altcoin market correction is not over yet, but BTC & ETH are holding key support zones.
Focus remains on BTC.D and USDT.D.
If BTC breaks 121 with volume and dominance drops, it’s a green light for altcoins.
📣 If this analysis helped you, hit the 🚀, leave a comment 💬, and follow for more updates!

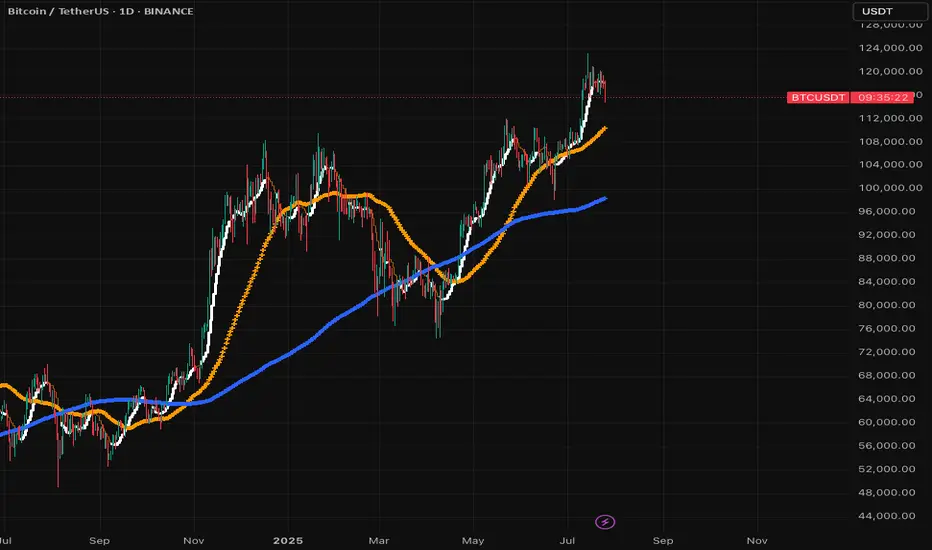
AI called it, Bitcoin listened! Now, will BTC stay the course?My AI saw Bitcoin's path weeks ago, and it's playing out PERFECTLY!
Uptrend, check.
Sideways pause? Check.
This cutting-edge tool is rewriting how we trade.
But now the stage is set for suspense...will it stay the course? Can it continue to defy the odds?
Lets see

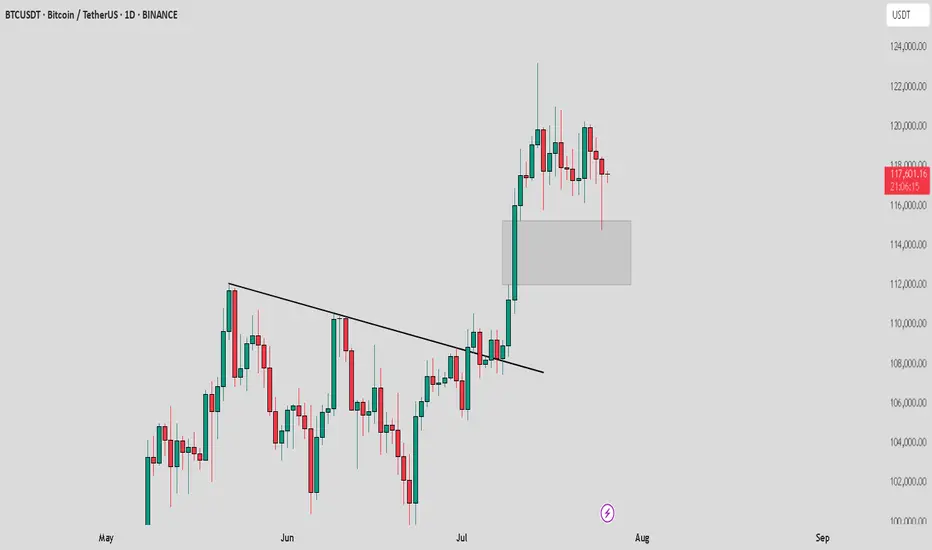
My thoughts on Bitcoin.. ABC -> 129K Top?I think we correct down to 112K area to fill the FVG and CME then we Turn up, topping at 129K and then the rest of the Alts blow off top from there..
Thoughts?

Are you Ready for Next Leg Up BTC Breakout is done on 4H wait for retest and you can take long after confirmation
TP 128K 130K For now
Bitcoin Breakout Bonanza - Ride the Wave, BroYo, check this Bitcoin chart, fam! We’re sittin’ at 107,725, and it’s lookin’ like a wild ride. That break above 127,725 is screamin’ bullish—time to ride the blue arrow up! But watch out, a drop below could send us crashin’ to 107,475 with that red arrow vibe. Stay sharp, dude!

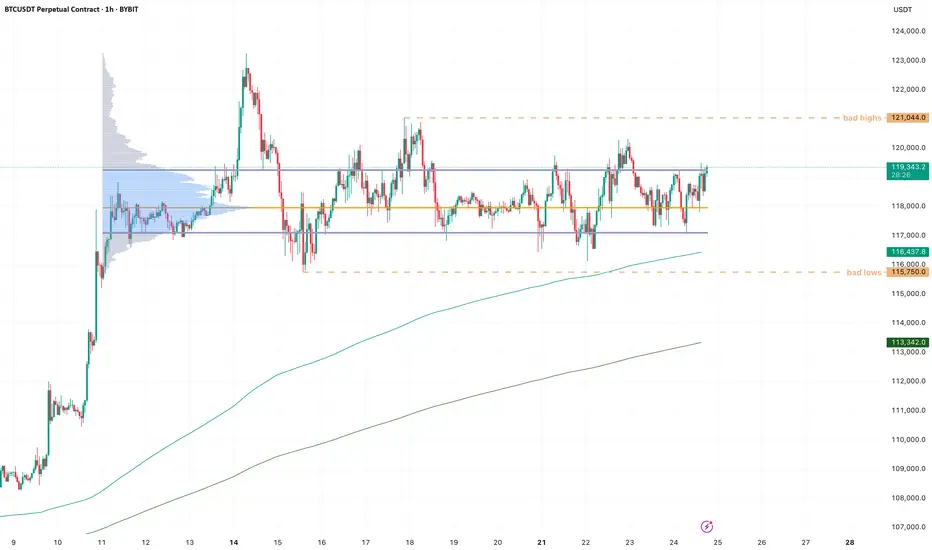
Market overview
WHAT HAPPENED?
Last week, after updating the historical maximum, bitcoin went into correction for the first time, after which it went sideways.
At the moment, the $117,300 – $116,300 zone has been retested (strong absorption of sales) and an active reaction from buyers has been received.
Within the current flat, the cumulative delta supports buyers, indicating the absorption of market sales. At the same time, the global wave structure on the 4H chart casts doubt on the last wave of buys, as we’ve rapidly adjusted back to its beginning.
💼 WHAT WILL HAPPEN: OR NOT?
We expect to exit the sideways at $116,000 – $121,000 in an upward direction from the current levels, either through capturing liquidity and testing the pushing volume zone at $115,000.
The target is the last ATH, which is $123,200. A re-correction is possible near $123,200, resulting in a wider flat range of $123,200 to $115,000. If there is a true breakout, we can expect the continuation of the global long trend.
Buy Zones:
~$115,000 (zone of initiating/pushing volumes)
$110,000–$107,000 (accumulated volume)
📰 IMPORTANT DATES
Macroeconomic events this week:
• Tuesday, July 22, 12:30 (UTC) — speech by Fed Chairman Jerome Powell;
• Wednesday, July 23, 14:00 (UTC) — publication of data on US second-hand housing sales for June;
• Thursday, July 24, 12:15 (UTC) — announcement of the deposit rate for July and the interest rate decision in the Eurozone;
• Thursday, July 24, 12:30 (UTC) — publication of the number of initial applications for unemployment benefits in the United States;
• Thursday, July 24, 12:45 (UTC) — press conference of the European Central Bank;
• Thursday, July 24, 13:45 (UTC) — publication of business activity indices (PMI) in the manufacturing and services sectors of the United States for July;
• Thursday, July 24, 14:00 (UTC) — publication of data on new home sales in the United States for June.
*This post is not a financial recommendation. Make decisions based on your own experience.
#analytics
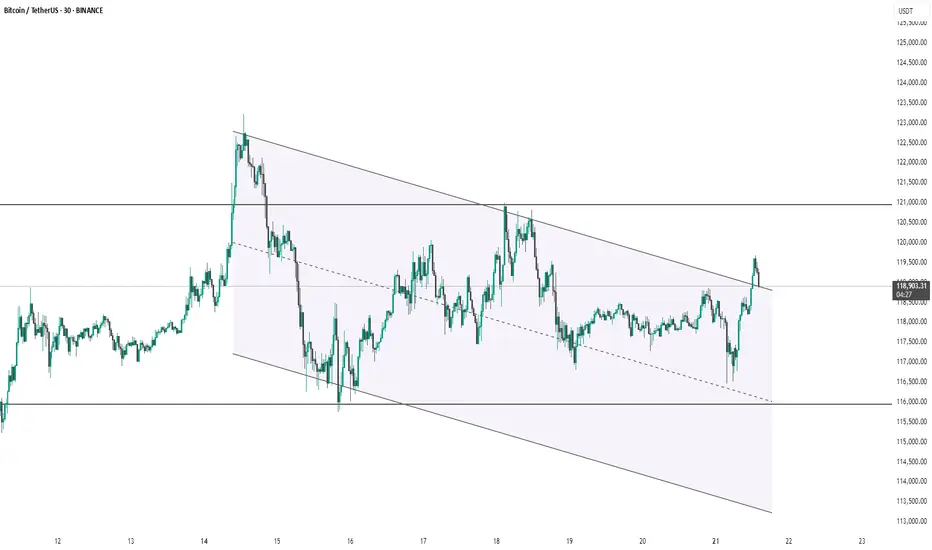
BTC #Bitcoin (BTC/USDT) 30-minute chartThis Bitcoin (BTC/USDT) 30-minute chart shows price action within a descending parallel channel. Recently, the price broke out above the channel's upper boundary, suggesting a potential bullish breakout. However, the price has slightly pulled back, now retesting the breakout zone near $119,000. Holding above this level may confirm the breakout and lead to further upside, while failure to hold could signal a false breakout and potential return into the channel. Key support and resistance levels are marked around $116,000 and $121,000 respectively.
thanking you
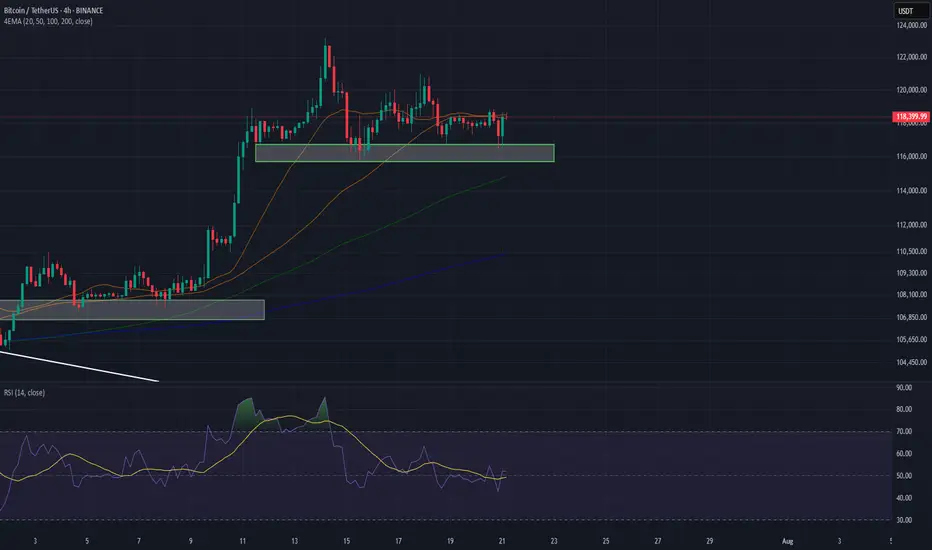
Bitcoin Technical AnalysisBTC made a recorded high of 123,218$ on Monday, and made a correction to 116k$ and keep consolidate in the range of 116k$-120k$, at the time of writing this bitcoin is currently trading at 118,224k$.
116k$-117k$ reacting as a strong support zone, if BTC breakdown this support zone the next target of bears is 112k$-110k$.
The Relative Strength Index (RSI) on the daily chart currently reads 64, having declined from last week's overbought level of 70. This suggests a cooling in bullish momentum, potentially signaling a pause or reversal in the recent upward trend.
Meanwhile, the Moving Average Convergence Divergence (MACD) is on the verge of forming a bearish crossover on the daily chart. If confirmed, this crossover would act as a sell signal, reinforcing the view of emerging bearish momentum.
However, if BTC closes above the $120,000 on a daily basis, it could extend the recovery toward the fresh all-time high at $123,218 and beyond.
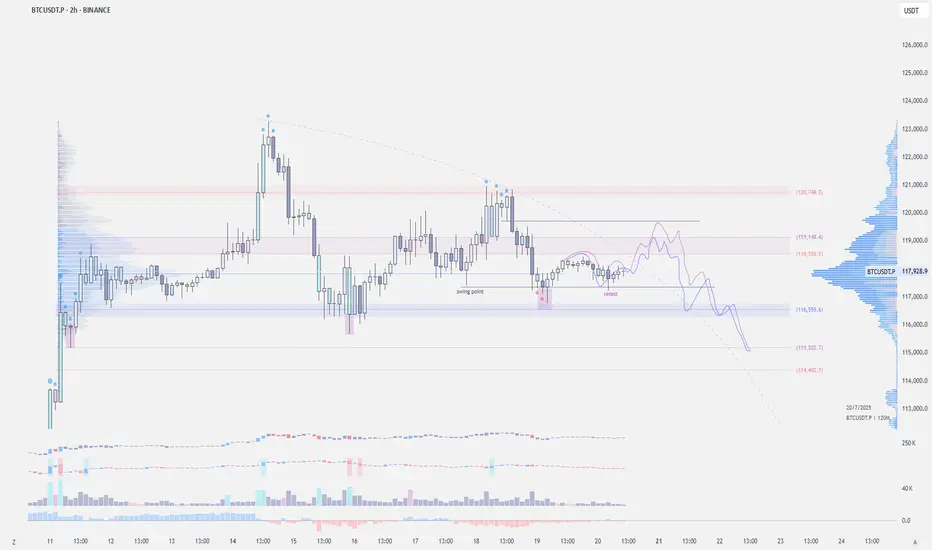
$BTC - Weekend LTF SetupCRYPTOCAP:BTC | 2h
Possible LTF setup:
We got the 2h swing point retest. If base support holds, I’m looking for a potential move back to 119k — possibly even a gap fill to 119.7k before taking out the local lows.
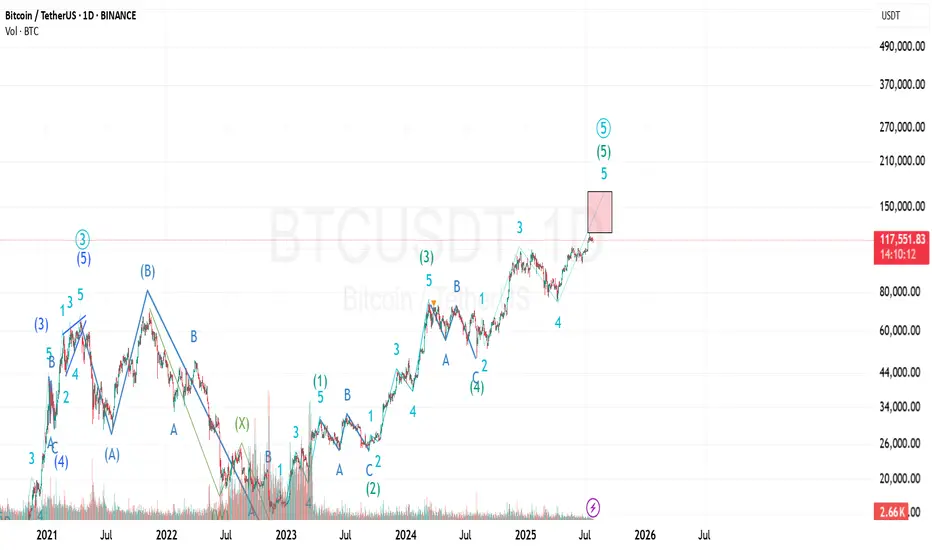
Bitcoin Prediction UpdateI've just modified the wave count and still the previous analysis is valid...
I'm not sure about the target of the last wave (the 5th of 5th wave) because it can be an extended wave...
The shown box is where I'll investigate to find any ending pattern...
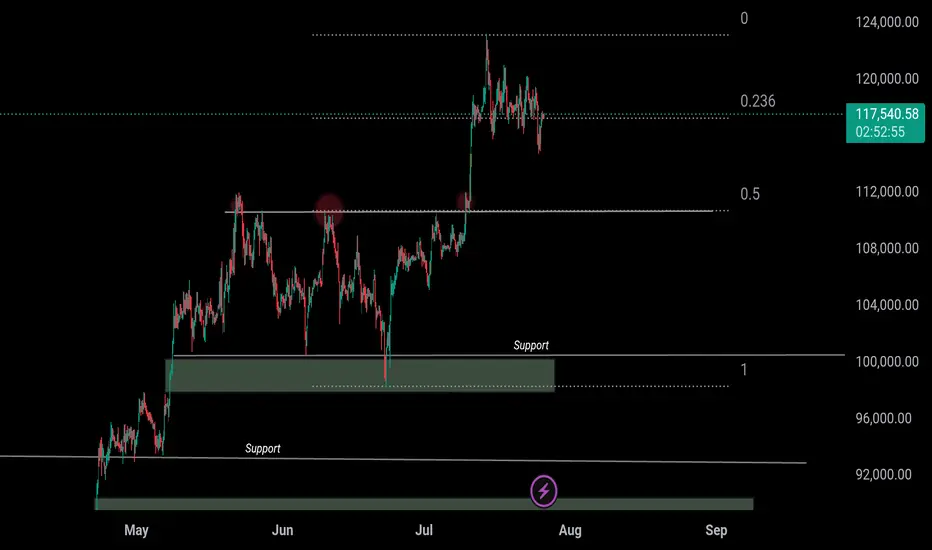
BTC 110k or 150k ??𝗪𝗶𝗹𝗹 CRYPTOCAP:BTC 𝗕𝗼𝘂𝗻𝗰𝗲 𝗮𝘁 $𝟭𝟭𝟬𝗞 𝗼𝗿 𝗖𝗿𝗮𝘀𝗵 𝗕𝗲𝗹𝗼𝘄 $𝟭𝟬𝟬𝗞? ‼️‼️
Breakout rallied from $110,500 → $123,293
Now pulling back toward 0.5 Fib retracement $110K
Retest Scenario:
– Hold above $110K = Bullish continuation toward $150K ATH
– Breakdown below $110K = Risk of deeper correction below $100K
Drop your thoughts below — bounce or breakdown?
CRYPTOCAP:BTC
Bitcoin Btc usdt Daily analysis
Time frame daily
If btc can't break the green uptrend line strongly I guess it drops to 87$
But if btc can continue it's sharp way , my target is 170 $
