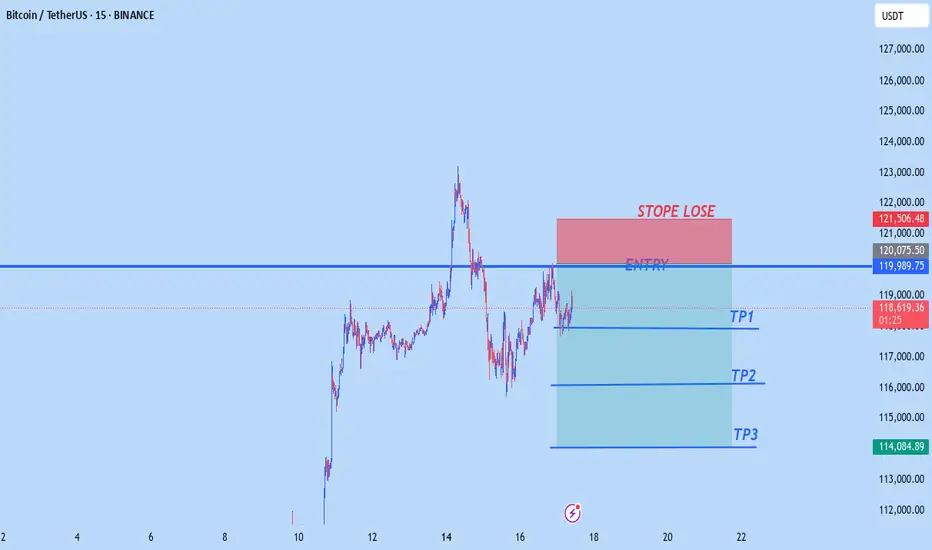
BTCUSD NEW OUTLOOK Btcusd sell from 120,000
tp1 118,000
tp2 116,000
tp3 114,000
Stopelose 121,500
Trade at your own risk
BTCDOWNUSDT trade ideas
Bitcoin Prediction that will blow your mind (warning for bulls) I am showing you that BTC made new ATH only in the USD pair and not in other pairs like EUR, and why, and what you can anticipate and what to watch out for from #Bitcoin next.

BTCUSD BUY PLAN FROM 4H DEMAND ZONEBTCUSD BUY PLAN FROM 4H DEMAND ZONE
Hence the trend is bullish we can plan for buys from demand zone.

Atomic Pump Exploded, You Missed It! Now What?Ever opened your charts after a few hours off and realized the market just exploded upwards without you?
That feeling of missing out, regret, and mental chaos is real.
But here’s the thing: if you missed the move, what should you do next?
This post is for you the ones who feel like the train left the station, but still want to win the next round.
Hello✌
Spend 3 minutes ⏰ reading this educational material.
🎯 Analytical Insight on Bitcoin :
Volume remains the decisive factor driving BINANCE:BTCUSDT toward higher price levels 📈. Across various scenarios whether it’s market battles, FOMO spikes, institutional capital flows, or extended periods of consolidation volume confirms the strength behind the move. Discussions about Bitcoin as the new global currency continue to fuel interest and momentum. In the short term, I’m targeting $129,000 for Bitcoin, representing roughly a 6% upside from current prices 🚀.
Now , let's dive into the educational section,
🧠 Understanding the Trader Psychology After Missing a Market Nuclear Explosion
When the market suddenly pumps, the first thought for many traders is: “I missed it.” That’s where the mental storm begins. Your mind starts blaming you, your analysis, or even bad luck. But all of that is just an emotional response.
The real question is can you use this moment to build your self-awareness and grow as a trader?
🧨 Turning Mistakes into Opportunities Without Self-Blame
Missing a pump isn’t necessarily a mistake it’s just an outcome. Maybe you didn’t check the charts, maybe fear held you back. What matters is: what did you learn?
A real trader documents every misstep, studies it, and adjusts next time. Turn that missed opportunity into a "pivot moment".
Keep a trading journal. Write why you missed it. What signs were there that you ignored? What can you do differently next time?
📊 TradingView Tools to Hunt the Next Big Move 🚀
When the market explodes, jumping in without a plan is a recipe for disaster. Step one? Turn off your emotions. Step two? Open up TradingView.
In moments like these, a few key tools can help you figure out whether the pump is over — or just getting started. One of the most powerful tools is Volume Profile Visible Range (VPVR). It shows you where volume is stacking up.
Heavy pumps usually lead to corrections, but if VPVR shows strong volume still holding higher levels, the opportunity may not be gone yet.
Next is the Relative Strength Index (RSI). If RSI is already above 70, chances are you're showing up late. But here’s the twist if there’s a small dip, RSI cools down, and then starts rising again… that might be your real chance to enter.
💥 When the Market Blows Up Like a Nuclear Bomb, How Do You React?
When green candles start stacking and everyone’s flexing profits, you’re left behind staring at a chart that feels like it betrayed you.
This is exactly when people make emotional decisions. But urgent hype is the enemy of good analysis. Your first job here: stay calm and look at the trend like a surgeon.
🧩 Greed vs. Logic Entering at the Top or Waiting for a Pullback?
The question isn’t whether to enter now. The real question is: why are you entering?
Because you feel left out? Or because your system gives you a signal?
If your decision isn’t based on a clean setup, you’re not trading you’re gambling. Logic must win over emotion. Every. Single. Time.
🧱 Coping With the Psychological Wall of Missing Out
The pain of missing out is real. It’s like arriving at the station just to see the train’s dust.
But here’s the truth: this wasn’t the last train.
One of the best traits of a great trader is the belief in future opportunities. If you chase what’s already gone, you’ll keep losing.
Instead, focus on rebuilding your mindset.
🎯 Smart Goal Setting: Prepare for the Next Wave, Don’t Chase the Previous One
Don’t chase a pump that’s already peaked. Instead, watch for early signs of the next one.
Look at coins that haven’t moved yet but are building momentum.
Focus on price action, volume behavior, hidden news, and reliable chart patterns. Let logic lead the way not FOMO.
🔄 What’s the Best Move After Missing a Pump? Maybe… Do Nothing
Sometimes, doing nothing is the best strategy.
The market isn’t a one-time lottery ticket. It gives out chances regularly but your impatient mind makes you believe you’re running out of time.
If your next move feels rushed, pause. Train your discipline to only trade with a cool head.
💡 Pro Tips to Come Back Stronger in the Next Big Move
Instead of regret, build a killer watchlist.
Set smart price alerts.
Go back to your past data and find recurring setups.
Sharpen your skills, study tools that help, and prepare for different scenarios.
Being prepared = staying ahead.
✨ Need a little love!
We pour love into every post your support keeps us inspired! 💛 Don’t be shy, we’d love to hear from you on comments. Big thanks , Mad Whale 🐋
📜Please make sure to do your own research before investing, and review the disclaimer provided at the end of each post.

Bitcoin Crash? No! The Bullish Wave Starts Now! $155,601 Next!Some people are still expecting for "Bitcoin to go down." Poor bastards, the advance is just starting. Bitcoin just broke out of a 210 days long consolidation phase. After this huge, long-term consolidation, expect a major advance. Next target is now set at $155,601.
This week is the first week green after the consolidation finally ends. The market was sideways for seven months, with some fluctuations, and the result is a bullish breakout. Why a breakdown? Why expect a drop? If the market just broke up—think about it—why would it go down?
If resistance is confirmed; you remember the range between $100,000 and $110,000. If resistance is confirmed then Bitcoin would start crashing down from $110,000. If the break of $110,000 does happen and Bitcoin moves to $112,000 as a bull-trap, then you would expect a major crash happening from $112,000 and no more. But, reality is saying, showing, something much different. We have a major advance. Resistance has been flipped into support.
Now, the first that is needed is the weekly close. It is still very early into this move but Bitcoin is showing maximum strength. Remember the altcoins? These confirm that the advance is just new, early, because these are recovering from all-time lows or major lows. There is still plenty of room for growth.
My people, wake up! Bitcoin is going up.
The next target is $155,601 and it can go higher, this is only the mid-term target based on the long-term. When Bitcoin consolidates for 7 months, it tends to grow some 137% on average, it can be less but it can also be much more. And it tends to grow at least for 1-2 months, but this also is just the average, Bitcoin can grow straight up for 4 months.
So, are you still bearish?
Oh please no! The bulls already won.
The 2025 bull market final phase starts now, soon you will experience a marketwide bull-run. We have not seen the euphoria phase, this is only the start. Prepare for additional growth.
I am calling out all of the bears, never bet down on Bitcoin; Bitcoin is going up.
Namaste.

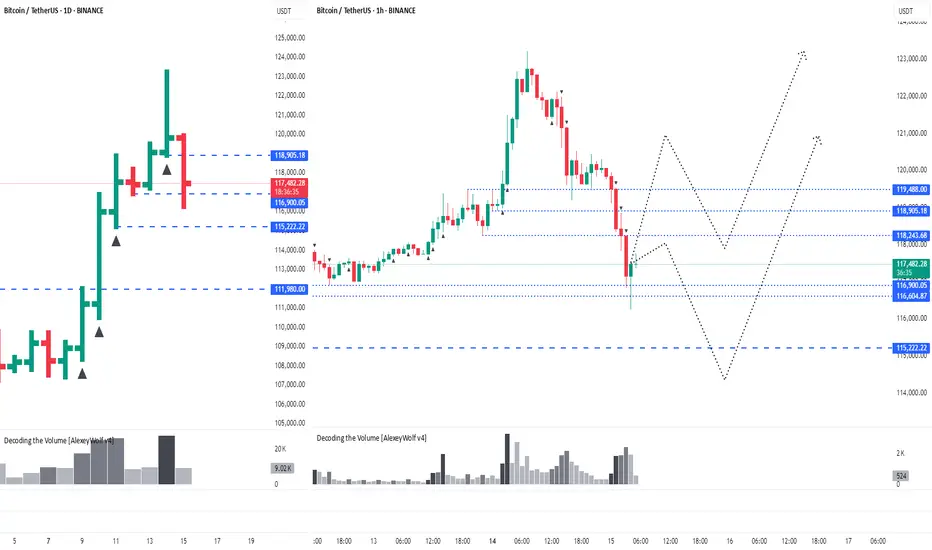
Bitcoin Hits New ATH – Is It Time to Short?Bitcoin ( BINANCE:BTCUSDT ) managed to form a new All-Time High(ATH) in the previous one-hour candles .
Do you think Bitcoin can create a new ATH in the coming hours?
Bitcoin is currently trying to break the Heavy Resistance zone($110,720-$105,820) . It has also penetrated the Potential Reversal Zone(PRZ) and Cumulative Short Liquidation Leverage($114,910-$113,850) .
In terms of Elliott wave theory , it seems that the 5 impulsive waves that Bitcoin started in the last 3 days can be completed above the ascending channel and PRZ .
Also, we can see the Regular Divergence(RD-) between Consecutive Peaks.
I expect Bitcoin to drop to at least Cumulative Long Liquidation Leverage($111,563-$110,947) . At least the price zone Bitcoin is in at the time of publishing this analysis is better for short positions , even if the Stop Loss(SL) is touched .
Note: Stop Loss(SL)= $115,023
Please respect each other's ideas and express them politely if you agree or disagree.
Bitcoin Analyze (BTCUSDT), 1-hour time frame.
Be sure to follow the updated ideas.
Do not forget to put a Stop loss for your positions (For every position you want to open).
Please follow your strategy and updates; this is just my Idea, and I will gladly see your ideas in this post.
Please do not forget the ✅' like '✅ button 🙏😊 & Share it with your friends; thanks, and Trade safe.

Global liquidity downtrend cometh!During this current BTC cycle, major uptrends in global liquidity have corresponded to major uptrends in the market 72ish days later. The last major uptrend in liquidity is about to run its course, pause, and then downtrend. If this relationship holds, we are at or near at least a pause in the local up trend. I have my popcorn ready to see if this plays out.
Note: The global liquidity prediction pauses until December 11th and then downtrends, so if we see floating higher prices until that point and then a pause, the relationship would still be valid.
Second Note: I will publish the BGL (Bitcoin Global Liquidity) indicator very shortly. Please test it out and DM me if you see any issues or have suggestions.
--Da_Prof

BTC/USDT – 4H Chart Technical AnalysisBTC/USDT – 4H Chart Technical Analysis
Market Structure & Trend
Overall Trend : Bearish (clearly defined by a consistent downtrend channel).
Current Structure : Price is in a corrective downtrend within a descending channel, after multiple rejections from the supply zone.
Key Technical Zones
1. Supply Zone
Strong rejection zone where the price previously reversed sharply.
Still acting as resistance, located around the upper range.
2. Demand Zone
Currently being retested for the fifth time, weakening its strength.
Recent price action shows liquidity sweep and swing low break inside this zone, potentially trapping early longs.
Fair Value Gaps (FVG) & Fibonacci Levels
1D FVG sits below the current demand, aligning with:
Golden Pocket (0.618–0.65 Fib).
Acts as a high-probability bounce zone for long entries if demand fails.
A break below this FVG could open up deeper downside toward the 0.786 Fib or beyond.
Psychological Levels
105,000 – Major resistance & potential take-profit area for long positions.
100,000 – Key support and liquidity magnet if the demand zone fails.
Volume Profile
High Volume Node: 102,000 – 106,800 — price tends to gravitate here, indicating potential consolidation or resistance.
Low Volume Area: Below 100,500 — suggests thin liquidity, which may cause sharp moves if price drops into this range.
Scenarios & Trade Ideas
Bullish Scenario
If price holds above the demand zone (after multiple retests) and confirms on LTF:
Potential Long to local resistance.
On breakout, target the 105,000 psychological level.
Confluence: High volume area offers both support and a magnet.
Bearish Scenario
If price fails to hold the demand zone:
Enter short position targeting the 1D FVG and 100,000 psychological level.
If that breaks, expect sharp continuation due to low volume below.
Conclusion
Price is at a pivotal point — currently balancing on weakened demand after multiple retests. Watch for LTF confirmation:
Above demand = bullish recovery setup.
Below demand = bearish continuation toward 100,000 and the FVG.
Manage risk tightly due to the proximity of both key zones.

BTC/USD Fake out before Pump | Bullish Flag formationBTC/USDT (1D) Market Outlook – July 1, 2025
Introduction
BTC is currently consolidating within a bullish flag pattern after printing a swing high at 108.9K and a recent swing low at 98K. The price sits just below a major supply zone.
Context 1: Key Zones
Supply: 104.6K – 112.1K
Demand: 74.4K – 82.5K
Fair Value Gaps (FVG): 3 zones below price, with one near 88–90K
Context 2: Technical Confluence
Liquidation Zone: 106.2K
Golden Pocket (Fib 0.618): 102.1K
Psychological Levels: 105K and 110K
Context 3: Market Structure
Pattern: Bullish flag
Trend (LTF): Sideways/consolidation
Volume Profile: Heavy activity near 105K–110K
Bullish Scenario
Breaks above 106.2K (liq zone)
Pulls back to 102.1K (golden pocket), forms higher low
Retests resistance for continuation
Alt scenario: clean breakout above resistance → ATH retest
Bearish Scenario
Breaks below 106.2K and flag support
Fills FVG, breaks prior low at 98K
Triggers macro downtrend toward 88–90K zone
Summary
BTC is at a decision point inside a bullish flag, facing supply. A break above 106.2K favors upside continuation, while rejection and a lower low could trigger a deeper retracement. Watch key levels closely.

BTC 141000Hello friends
I think Bitcoin has another correction to 113662 and then it will climb to 141000.

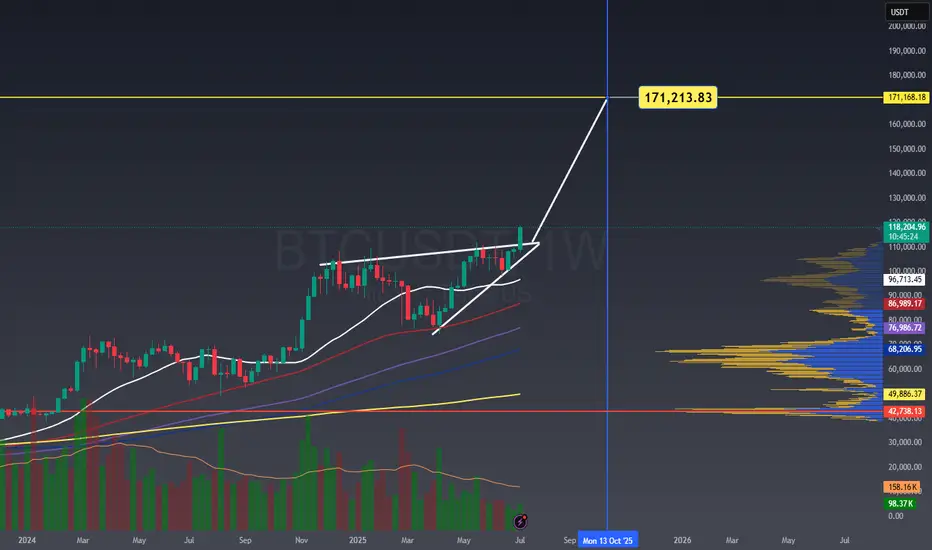
BTC TO 172K BY Oct 13, 2025BTC TO 172K BY Oct 13, 2025
rising wedge inverted head and shoulder measured move to the upside 172k
Golden Bitcoin Signal: A Great Investment Opportunity🔔 Our Bitcoin Investment Bot has issued an exclusive signal! This signal, backed by 15 years of historical data analysis, marks the perfect time to enter the market. 🎯 Take Profit Target: $120,975 (equivalent to a potential 50.5% profit)
⚖️ Professional Risk Management: This signal comes with a Stop Loss at $66,835 (16.8% risk), offering an ideal balance of profit and risk. Our bot, with its advanced and data-driven strategies, identifies the most valuable investment opportunities.
⏳ Opportunities don’t last forever! This signal could be the start of a significant move. Now is the best time to act and take advantage of this precise analysis. With our bot, you’re one step closer to sustainable profitability. 🌟

BTCUSDT: A Period of Adjustment and the Next TrendAfter a strong rally to record highs, BTCUSDT is currently entering a period of slight correction. The coin is now trading around 118,500 USD, down more than 0.57% on the day.
From a technical perspective, BTCUSD is moving within a narrowing price wedge, showing a slight downtrend. The support level at 116,500 USD is acting as a springboard for the Bulls. However, as the price approaches the tip of the wedge, a breakout may occur at any time, with two possible scenarios highlighted on the chart.
My personal outlook is that BTCUSDT will continue to decline in the short term before breaking out of the wedge in an upward direction. What do you think about BTCUSDT?
Please share your thoughts in the comments and don’t forget to like this post!
Wishing you all happy and successful trading!

BTC/USDT (1H) Market Analysis – July 19
BTC is hovering just below the 200 EMA, having recently bounced off it with a small recovery candle.
The recent downtrend from the $121K peak has flattened, and price is forming a potential short-term base above the $117K support.
There's low-volume chop, suggesting indecision or a pause before the next leg.
Key Technical Levels
Support zone: $117,200 – $117,500 (200 EMA + recent wick support)
Resistance zone: $118,500 – $119,000 (cluster of short EMAs + prior supply)
Breakout level: $119,500 (for a bullish continuation)
Breakdown level: $116,800 (for further downside)
Indicator Insights
RSI: 42.86 and curling up slightly → shows a potential recovery attempt but still below neutral.
QQE MOD: Deep in bearish territory (–8.53), but we’re seeing the first signs of easing negative momentum.
ATR: 681 and gradually falling → declining volatility, aligning with consolidation.
Bias & Scenarios
Bullish Case:
If BTC holds above the 200 EMA and breaks above $118.5K with volume, we could see a retest of the $119.5K–$120K zone.
RSI breaking 50 and QQE printing lighter red would confirm upward momentum.
Bearish Case:
Failure to reclaim EMAs and a drop below $117K could send price toward $116K or even back to the breakout base at $114.5K.
Watch for volume spikes on red candles and RSI breaking back under 40.

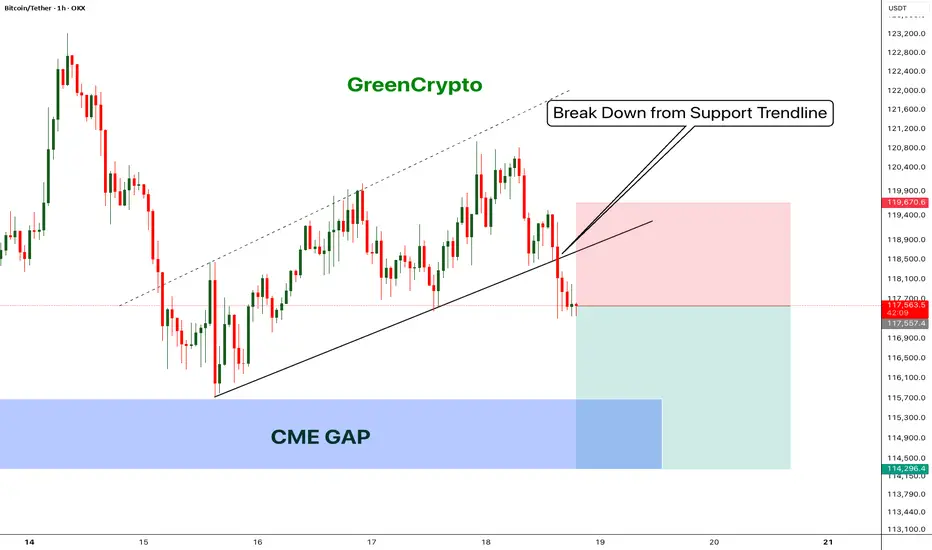
Bitcoin - Bears will push the price fill CME Gap- Bitcoin has broken down from the trending support,
- Price has been going down without any retracement on 1H candle.
- Looks like bitcoin will CME gap before going up further.
- A high risk Short Trade opportunity is here
Entry: 117,431
Stop Loss: 119,670
TP1: 116152.8
TP2: 114403.6
Move SL to Breakeven on TP1 hit
Don't forget to like and follow
Cheers
GreenCrypto
BTCUSDT Smart Zone Entry + Take Profit MapThe BTCUSDT chart on both the 1H and 4H timeframes shows a clear consolidation above a high-timeframe support zone with early signs of bullish continuation. This setup outlines a well-defined "Buy Zone," backed by recent demand re-tests, with Take Profit (TP) levels mapped out based on prior highs and price inefficiencies.
Buy Zone (Demand Zone):
The shaded area on the 1H/4H chart marks a critical support zone between ~$117,800 and $119,300. This range aligns with past consolidation, a 4H EMA cluster, and prior bullish reactions. Entries within this zone offer a high reward-to-risk setup.
Support Level:
$117,800, the base of the demand zone, is the final line of support. A clean break and close below this level would invalidate the current long bias.
Take Profit Levels (TPs):
TP1 (~$122,000): Previous local resistance and recent high.
TP2 (~$123,300): Upper wick high and liquidity zone.
TP3 (~$124,500): Untapped zone from early July, likely liquidity pool.
Supporting Indicators:
RSI: Recovering from mid-range, showing hidden bullish divergence on lower timeframes.
QQE MOD: Flipping from bearish to bullish momentum.
ATR: Declining volatility post-drop indicates possible accumulation before breakout.
After a sharp pullback, BTC is stabilizing above a demand zone and forming a potential base. As long as price remains above ~$117,800, there's confluence for a continuation higher, with the outlined TP levels offering natural exit points for partial or full profits.

BTC Just Broke the High - But Don't get Trapped!Bitcoin just swept the recent high, triggering breakout euphoria. But this could be a classic liquidity grab, not a true breakout. If price fails to hold above the level and shifts structure, we may see a sharp bearish reversal BINANCE:BTCUSDT BINANCE:ETHUSDT 👀
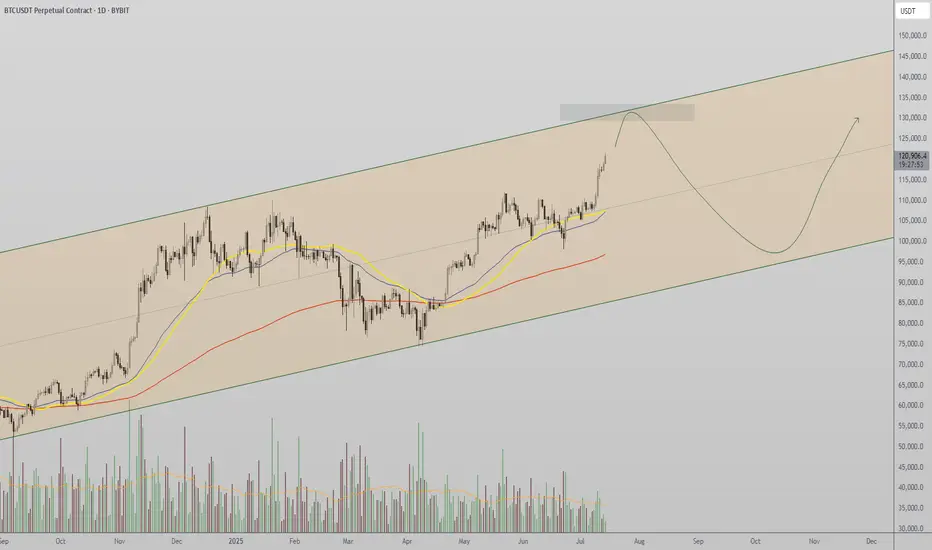
$130K Channel Resistance — Bullish Structure Intact Bitcoin continues its strong uptrend, pushing toward high time frame resistance at $130K. With no bearish structure in sight, short-term momentum favors continuation unless resistance prompts a reversal.
Bitcoin is showing continued strength in the immediate short term, with price steadily advancing toward the $130,000 high time frame channel resistance. This level marks the upper boundary of a macro trend channel and presents the next critical test for BTC. While this zone may act as a barrier, the market remains structurally bullish, and further upside remains possible before any meaningful correction takes place.
Key Technical Points:
- Channel Resistance at $130K: Major high time frame level to watch
- Bullish Market Structure: Consecutive higher highs and higher lows on lower time frames
- No Bearish Reversal Signs Yet: No structural break or shift to indicate correction
Bitcoin’s price action has been defined by clear bullish structure, especially on the lower time frames, where the market continues to print higher highs and higher lows. This confirms that bulls are still in control and dips are being bought aggressively, maintaining the strength of the trend.
The next major technical level is the $130K resistance, which aligns with the upper boundary of a long-term ascending channel. This area is likely to serve as a key decision zone. If price approaches this region without any signs of exhaustion or bearish divergence, the probability of a brief breakout or retest increases.
However, it is also important to consider this level as a potential inflection point. If price begins to stall at or near $130K — especially with declining volume or a shift in short-term structure — it could signal the beginning of a corrective move. Until such a development occurs, however, the market remains decisively bullish.
Traders should closely monitor intraday structure around the $130K zone. A clean break above on strong volume would indicate continued strength and could open the path toward further price discovery. Conversely, the first sign of weakness would be a break of short-term support levels and failure to form new highs — neither of which has occurred yet.
Bitcoin remains bullish in the short term as it approaches $130K resistance. Unless a structural break occurs or bearish signals appear, further upside remains likely before any correction sets in.
BTCUSDT. Current scenario range Current scenario range — can shift depending on how the market reacts next.
This analysis is based on the Initiative Analysis concept (IA).
Wishing you profitable trades!
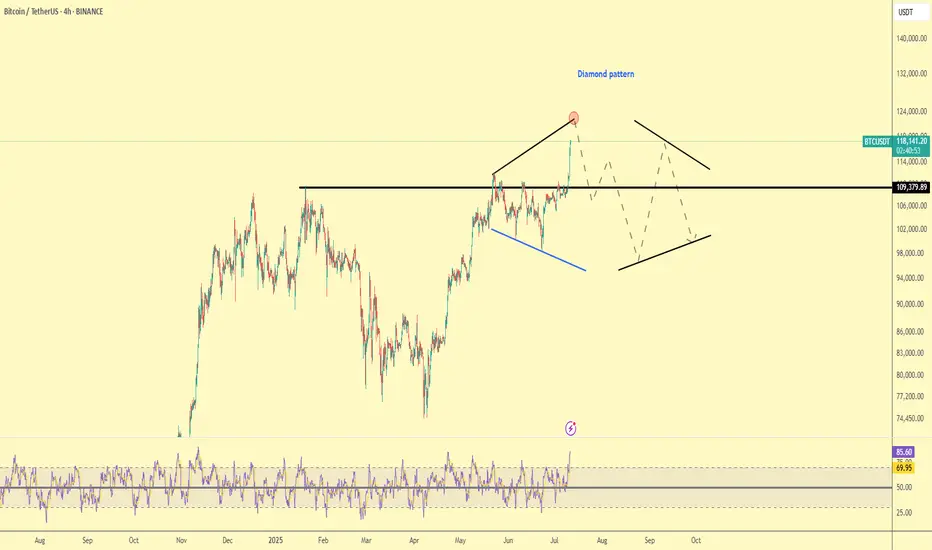
BTC TRADE PLAN 11/07/2025 - Diamond PatternDear traders,
Technical Analysis of BTCUSDT (Bitcoin/USDT) – July 11, 2025
🕐 Timeframe: 4H
Price has broken above the major resistance at $110,000 and is now trading around $118,000, forming a Diamond Top pattern — a classic reversal formation that may signal an upcoming downtrend or correction.
🔻 Key Highlights:
Major Resistance: $118,000 – current top and potential reversal point.
Key Support: $110,000 – if broken, next targets may lie around $95,000–$100,000.
Diamond Pattern: Typically a bearish reversal signal after a strong uptrend.
RSI Indicator: Currently in overbought territory (above 85), suggesting buyer exhaustion.
📉 Possible Scenario:
Price may reverse from $118,000 -120,000 and test the $110,000 support. A break below that could lead to a deeper correction in the coming weeks.
Regards,
Alireza!
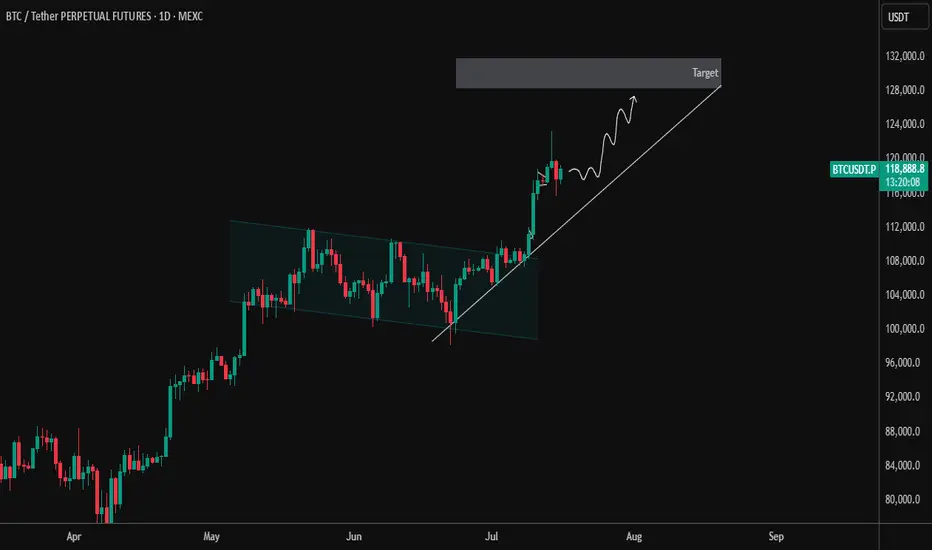
BTCUSDT 1 Day – Breakout and Retest Completed | Next TargetBTC has officially broken out of the descending parallel channel that dominated price action from mid-May to early July. After a successful breakout, price pulled back for a clean retest of the channel resistance, which has now flipped to support — a classic bullish continuation signal.
🔹 Key Technical Highlights:
✅ Breakout from descending channel structure
✅ Retest of breakout zone confirmed with strong bullish candles
🔼 Current Price: ~$118,971 (as of chart time)
📈 Short-Term Structure: Following a clean higher-low formation with ascending trendline support
🎯 Target Zone: $128,000–$130,000 (next key resistance area)
As long as BTC maintains this ascending support line, the momentum remains with the bulls. Any dips toward the trendline may offer good long opportunities with proper risk management.
📌 Watch for:
Rejection near the target zone
Bullish continuation patterns like flag/pennant on lower timeframes
Volume confirmation during breakout attempts
Let the trend be your friend. Trade safe! ⚡
BITCOIN → Stopping after the rally? What next? 125K or 110K?BINANCE:BTCUSDT rose and updated its historical maximum to a new record of 118K with “kopecks” (different prices on different exchanges). Now the price has supposedly stopped and entered a consolidation phase, but it is too early to draw any conclusions based on this alone...
Fundamentally, Bitcoin rose following the SP500 and NQ100 indices. The reasons are clearly geopolitical. The correlation level is not high, but the flagship is following the stock indices, which are also updating their historical highs.
Technically, Bitcoin has emerged from a two-month consolidation and entered a realization phase. So what's next? Continuation of the phase or correction? Let's take a look.
On the daily chart, I would highlight two zones. The risk and sell zone is below 117,500. If the price closes below this zone today/tomorrow, we will most likely be able to look for signals for a possible correction. As part of the correction, we can expect a decline to 115,500, 114,300, or even to the old ATH of 112K.
The second zone is the buying zone. A closing price above 118,400–118,900 and consolidation with the gradual formation of a breakout of structure may hint at a possible continuation of growth toward psychological targets.
Resistance levels: 118,400, 118900
Support levels: 117100, 116700, 115500
In the chart above, I have highlighted the situations, levels, and zones that interest me more precisely.
Now I am waiting for Bitcoin to retest resistance or support and confirm certain levels, based on which decisions can be made. I think that in the near future, Bitcoin will show us where it is headed. Updates will be published as something interesting emerges...
Best regards, R. Linda!

HolderStat┆BTCUSD above $120BINANCE:BTCUSDT has surged past $129,000 following a breakout from long-term consolidation. The chart shows a clean continuation structure with the next resistance between $135,000–$137,000. Momentum remains on the side of bulls.
