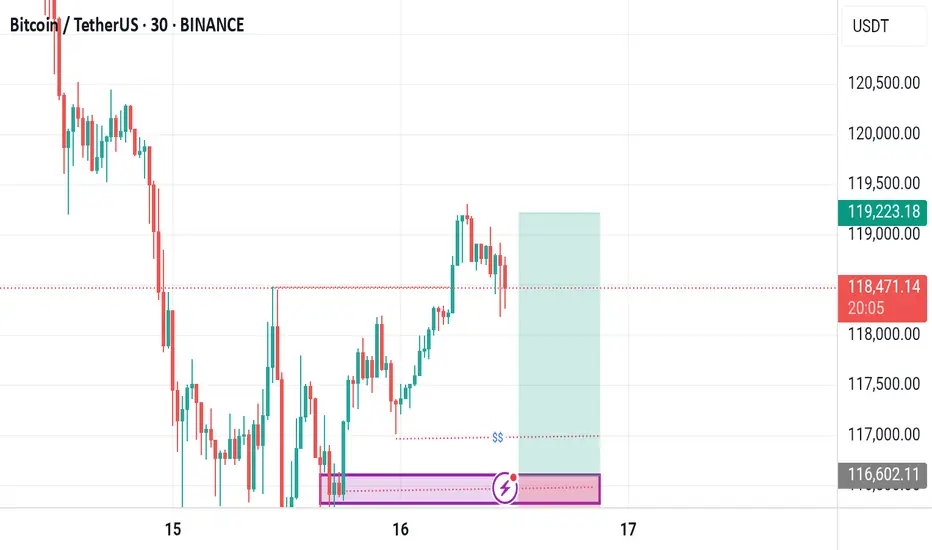
BITCOIN → Stopping after the rally? What next? 125K or 110K?BINANCE:BTCUSDT rose and updated its historical maximum to a new record of 118K with “kopecks” (different prices on different exchanges). Now the price has supposedly stopped and entered a consolidation phase, but it is too early to draw any conclusions based on this alone...
Fundamentally, Bitcoin rose following the SP500 and NQ100 indices. The reasons are clearly geopolitical. The correlation level is not high, but the flagship is following the stock indices, which are also updating their historical highs.
Technically, Bitcoin has emerged from a two-month consolidation and entered a realization phase. So what's next? Continuation of the phase or correction? Let's take a look.
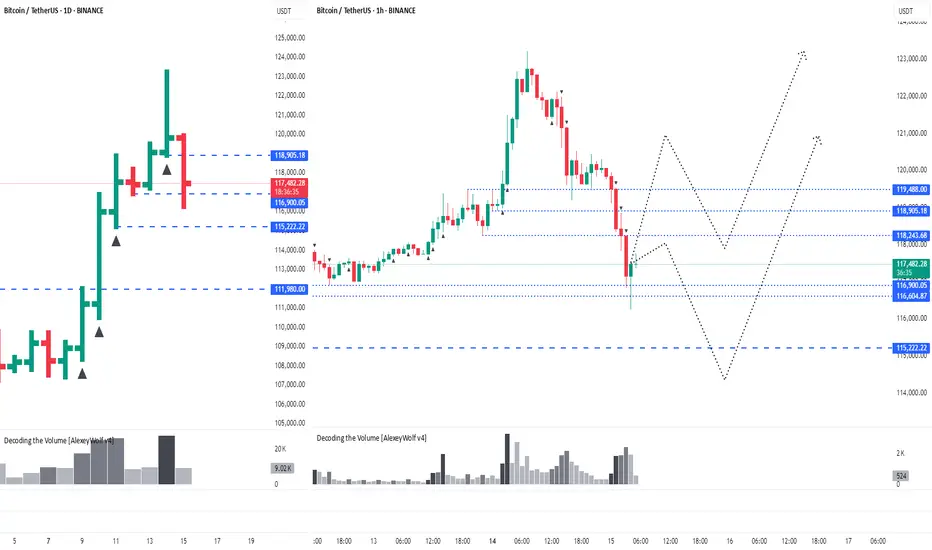
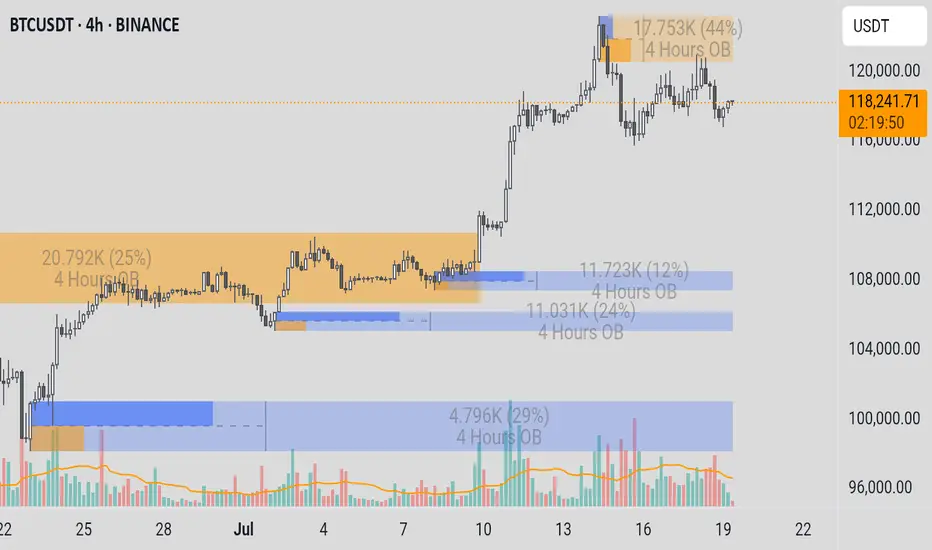
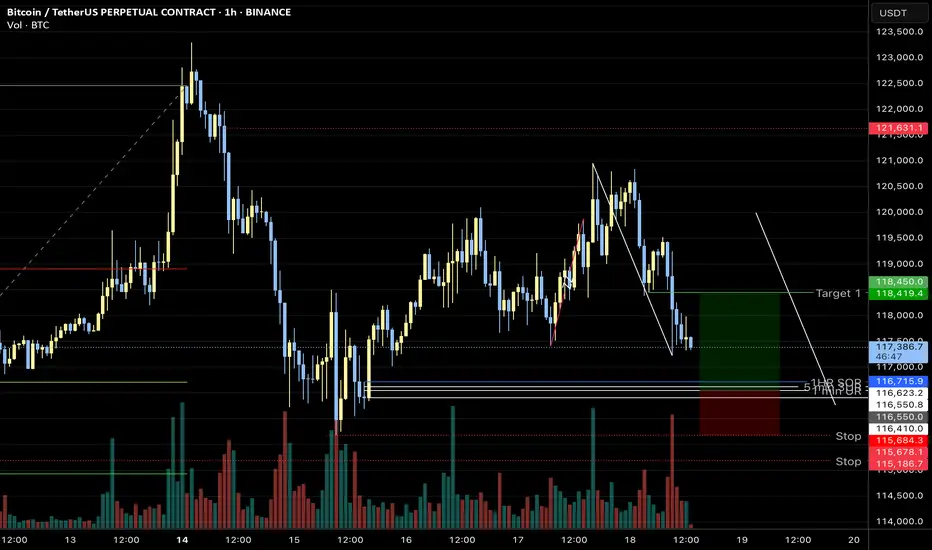
On the daily chart, I would highlight two zones. The risk and sell zone is below 117,500. If the price closes below this zone today/tomorrow, we will most likely be able to look for signals for a possible correction. As part of the correction, we can expect a decline to 115,500, 114,300, or even to the old ATH of 112K.
The second zone is the buying zone. A closing price above 118,400–118,900 and consolidation with the gradual formation of a breakout of structure may hint at a possible continuation of growth toward psychological targets.
Resistance levels: 118,400, 118900
Support levels: 117100, 116700, 115500
In the chart above, I have highlighted the situations, levels, and zones that interest me more precisely.
Now I am waiting for Bitcoin to retest resistance or support and confirm certain levels, based on which decisions can be made. I think that in the near future, Bitcoin will show us where it is headed. Updates will be published as something interesting emerges...
Best regards, R. Linda!
BTCDOWNUSDT trade ideas

BTC AI Prediction Dashboard - 6h Price Path (17.07.25)
Prediction made using Crypticorn AI Prediction Dashboard
Link in bio
BTCUSDT Forecast:
Crypticorn AI Prediction Dashboard Projects 6h Price Path (Forward-Only)
Forecast timestamp: ~10:30 UTC
Timeframe: 15m
Prediction horizon: 6 hours
Model output:
Central estimate (blue line): -119,394
Represents the AI’s best estimate of BTC’s near-term price direction.
80% confidence band (light blue): 118,475 – 119,566
The light blue zone marks the 80% confidence range — the most likely area for price to close
40% confidence band (dark blue): 117,621 – 120,336
The dark blue zone shows the narrower 40% confidence range, where price is expected to stay with higher concentration
Volume on signal bar: 121.96
This chart shows a short-term Bitcoin price forecast using AI-generated confidence zones.
Candlesticks reflect actual BTC/USDT price action in 15-minute intervals.
This helps visualize expected volatility and potential price zones in the short term.

Potential path for BTC (no free lunch)
The market gets horny as PA moves into the weekly open again.
BTC pulls an F-you move and dumps into the Daily fair value gap
THEN continuation actually happens

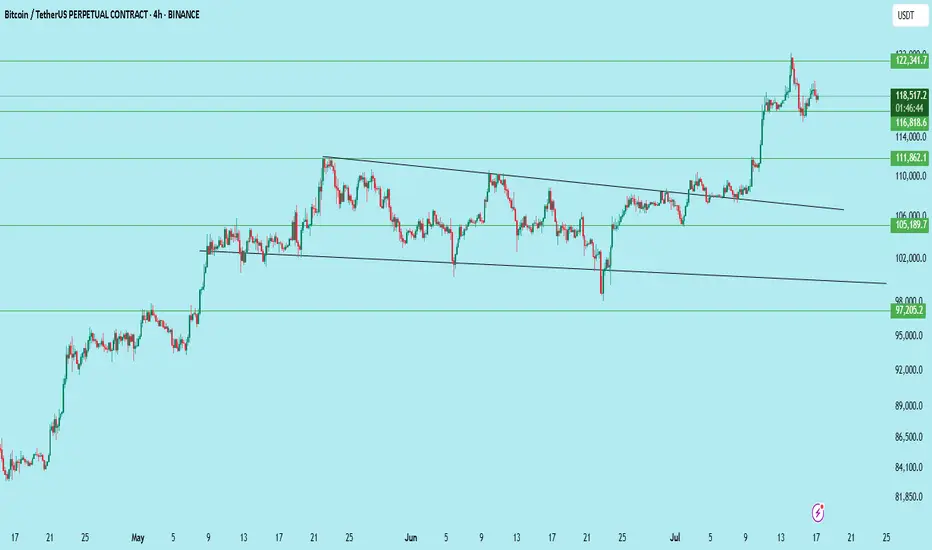
#BTCUSDT | Massive Breakout – Now What?Bitcoin has broken out of a multi-week descending wedge on the 4H chart — a classic bullish reversal pattern. Price is now consolidating just above $116,818 support, forming a base for the next leg up.
What Just Happened:
Clean breakout above the wedge resistance
Strong momentum candle above $111,862
Immediate rejection near $122,341
Currently retesting the previous breakout zone
Key Levels:
Resistance: $122,341
Support: $116,818 → key short-term level
Breakout Support: $111,862
Deeper Support: $105,189
Invalidation Level: $97,205
Bullish Outlook:
If BTC holds $116,818 and breaks above $122,341 with volume, the next leg could extend toward $128,000–$132,000.
Bearish Risk:
Losing $116,818 with volume → look for retest near $111,862 or even $105,189 for a stronger bounce.
Bias:
Bullish above $116,818 — watching for consolidation before continuation.
Trade Setup (if planning to enter):
Entry on retest of $116,818–$117,000
SL: Below $114,000
TP1: $122,341
TP2: $128,000
TP3: $132,000
DYOR | Not Financial Advice
BTCUSDT. Current scenario range Current scenario range — can shift depending on how the market reacts next.
This analysis is based on the Initiative Analysis concept (IA).
Wishing you profitable trades!
Bitcoin short from 121kLooking for shorts at these leveks.
Target aroind cme gap.
Also npoc level is down at that region.
Patiently waiting.

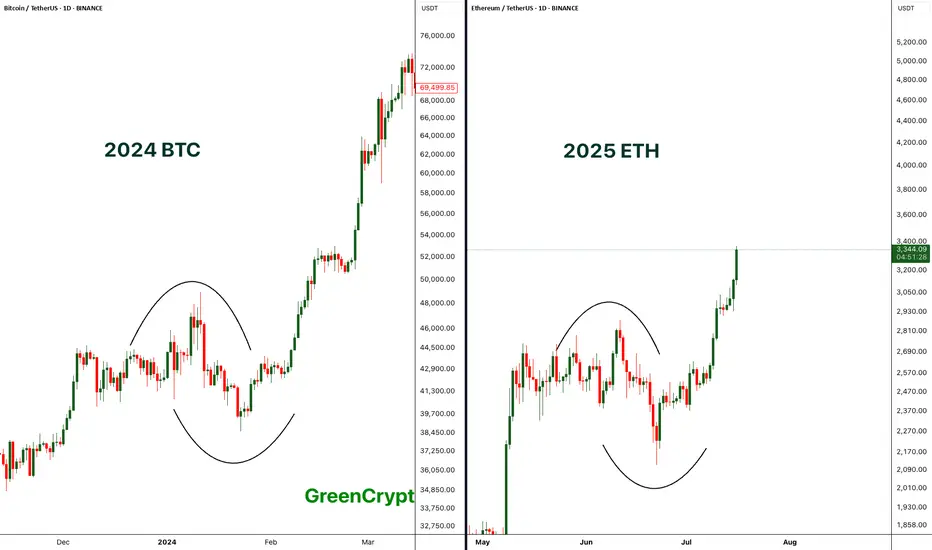
Comparing BTC 2024 with ETH 2025 - Perfect Match- If compare the chart pattern of BTC from 2024 with the current 2025 ETH pattern, wee see exactly similar chart patterns being formed here.
- Price started consolidating then it had fake breakout towards both the sides and finally the real breakout.
- BTC breakout push the price towards the new all time high above 69K, if we ETH follows similar trend then we can expect new all time high on ETH.
Let's see how it plays out.
Stay tuned for more updates.
Cheers
GreenCrypto
BTC/USDT – 4H Chart Technical AnalysisBTC/USDT – 4H Chart Technical Analysis
Market Structure & Trend
Overall Trend : Bearish (clearly defined by a consistent downtrend channel).
Current Structure : Price is in a corrective downtrend within a descending channel, after multiple rejections from the supply zone.
Key Technical Zones
1. Supply Zone
Strong rejection zone where the price previously reversed sharply.
Still acting as resistance, located around the upper range.
2. Demand Zone
Currently being retested for the fifth time, weakening its strength.
Recent price action shows liquidity sweep and swing low break inside this zone, potentially trapping early longs.
Fair Value Gaps (FVG) & Fibonacci Levels
1D FVG sits below the current demand, aligning with:
Golden Pocket (0.618–0.65 Fib).
Acts as a high-probability bounce zone for long entries if demand fails.
A break below this FVG could open up deeper downside toward the 0.786 Fib or beyond.
Psychological Levels
105,000 – Major resistance & potential take-profit area for long positions.
100,000 – Key support and liquidity magnet if the demand zone fails.
Volume Profile
High Volume Node: 102,000 – 106,800 — price tends to gravitate here, indicating potential consolidation or resistance.
Low Volume Area: Below 100,500 — suggests thin liquidity, which may cause sharp moves if price drops into this range.
Scenarios & Trade Ideas
Bullish Scenario
If price holds above the demand zone (after multiple retests) and confirms on LTF:
Potential Long to local resistance.
On breakout, target the 105,000 psychological level.
Confluence: High volume area offers both support and a magnet.
Bearish Scenario
If price fails to hold the demand zone:
Enter short position targeting the 1D FVG and 100,000 psychological level.
If that breaks, expect sharp continuation due to low volume below.
Conclusion
Price is at a pivotal point — currently balancing on weakened demand after multiple retests. Watch for LTF confirmation:
Above demand = bullish recovery setup.
Below demand = bearish continuation toward 100,000 and the FVG.
Manage risk tightly due to the proximity of both key zones.

HolderStat┆BTCUSD above $120BINANCE:BTCUSDT has surged past $129,000 following a breakout from long-term consolidation. The chart shows a clean continuation structure with the next resistance between $135,000–$137,000. Momentum remains on the side of bulls.

BTC buy signalBitcoin is ready to rally upward targeting the swing point that broke above the market structure, so we expect a pullback to the order block bellow the liquidity zone as our point of interest.
BTC/USDT Technical Analysis Market Overview
Bitcoin is currently trading at $118,788, with an intraday high of $119,311. The market has recently tested a major resistance zone and is showing signs of a potential pullback toward a key demand zone before a possible continuation to higher levels.
Projected Scenario (Bullish Bias)
Expected pullback to the support zone around $105K – $108K.
If price holds and shows a bullish reversal, a breakout above $124K is expected.
Primary upside target: $142,807 (Fibonacci projection / potential new high).
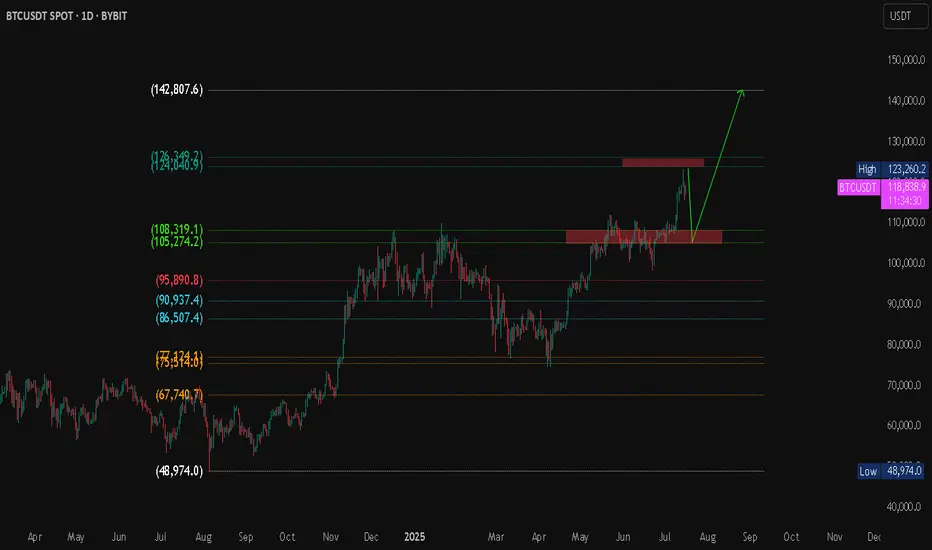
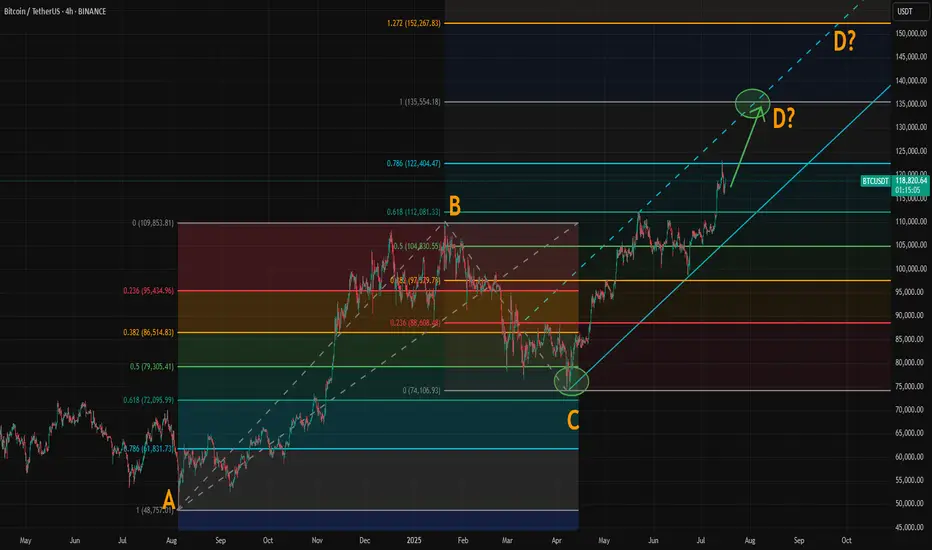
Where Could Bitcoin Make Its Cycle Top? Model and ABCD AlignedWith the breakout above resistance around 110,000, Bitcoin’s rally appears to be back on track. If you've been following our crypto analysis, either here or on our website, you’ll know our target range for this bull cycle is between 135,000 and 150,000, with the top of the range possibly extending further depending on the strength of the final wave.
Now, a possible ABCD pattern is forming, with point D potentially landing at either 135,000 or 150,000. A coincidence? Maybe, maybe not.
How Did We Arrive at the 135K–150K Target?
We based this range on historical halving cycle returns:
Halving Year - Return to Cycle Top
2012 - 9,076%
2016 - 2,122% (↓ 4.27x)
2020 - 541% (↓ 3.92x)
Two things stand out:
Each cycle has shown diminishing returns.
The rate of decline appears roughly consistent, dropping by around 4x each time—but slightly less with each cycle.
So depending on the multiplier used:
If returns fall by 4.27x again → target: 135K
If reduced by 4x → target: 140K
If reduced by 3.92x → target: 142K
If the rate of reduction itself slows (difference of 0.35 between 4.27 and 3.92) → target: 150K
While the sample size is too small, we believe the model holds reasonable logic with fundamental backing from various metrics.
The chart now shows a possible ABCD pattern:
If it becomes a classic AB = CD structure, point D could form near 135K.
If it becomes an extended ABCD (with CD = AB × 1.272), then point D could reach just above 150K.
These technical targets align closely with our halving model projections, increasing our confidence in the 135K–150K range as a likely top zone for this cycle.
Also, please check our earlier post for possible altseason start. A correlation between BTC/ETH and Gold/Silver might give some tips about possible Ether surge.
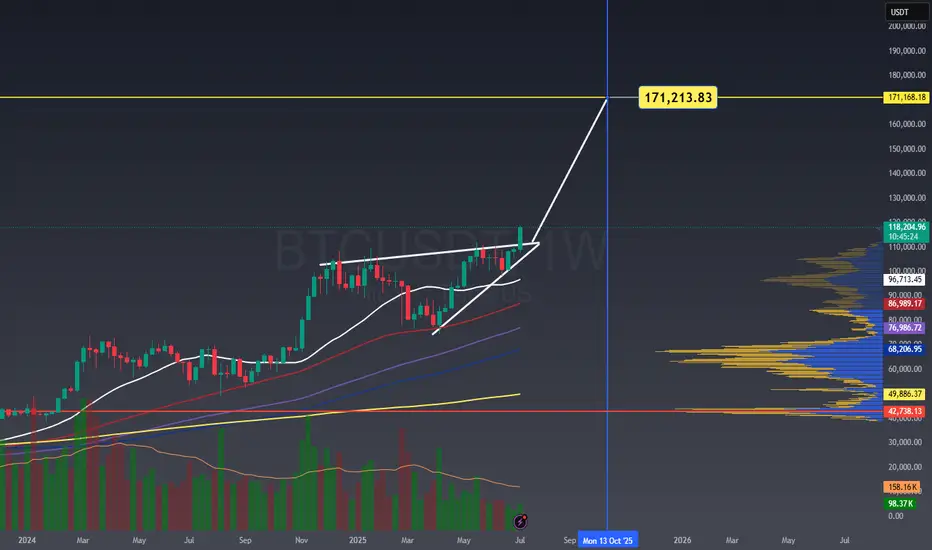
BTC TO 172K BY Oct 13, 2025BTC TO 172K BY Oct 13, 2025
rising wedge inverted head and shoulder measured move to the upside 172k
Bitcoin Liquidity updateCRYPTOCAP:BTC
📄 Update on liquidity movement and key liquidity cluster points
◀️ Summary of the first movement: A sale occurred at 121826 and a break happened at 117612, after which liquidity was collected between 116 - 115
◀️ After collecting liquidity, we mentioned that breaking 117612 would allow testing 119723, and that is what happened
⭕️ Now, a selling range has formed between 120813 - 121826, which is clear on the price chart and the way it bounced down
🟣 The current movement is confined between 118398 - 117612
📄 Regarding trading ideas:
⭕️ The thought here is to buy between 11600 - 114813 if a break occurs at 117612 and trading starts below it
⭕️ The second idea, in case this break does not happen, is to wait for confirmation of trading above 118398, and in this case, it's preferable to wait until Monday

BTCUSDT BTC/USDT (Bitcoin):
Trend: Strong uptrend.
Current Conditions: Price is near key resistance around $117,000-$121,000 after a sharp rise.
Entry Recommendation: Entry is not recommended at this time. It is better to wait for a correction to the previous support area (e.g., $109,000-$111,000 or $105,000-$108,000) and look for confirmation of a bullish reversal. Entry at current levels is high risk due to the potential for a correction.
Cryptocurrency Futures Market Disclaimer 🚨🚨🚨
Trading cryptocurrency futures involves high risks and is not suitable for all investors.
Cryptocurrency prices are highly volatile, which can lead to significant gains or losses in a short period.
Before engaging in crypto futures trading, consider your risk tolerance, experience, and financial situation.
Risk of Loss: You may lose more than your initial capital due to the leveraged nature of futures. You are fully responsible for any losses incurred.
Market Volatility: Crypto prices can fluctuate significantly due to factors such as market sentiment, regulations, or unforeseen events.
Leverage Risk: The use of leverage can amplify profits but also increases the risk of total loss.
Regulatory Uncertainty: Regulations related to cryptocurrencies vary by jurisdiction and may change, affecting the value or legality of trading.
Technical Risks: Platform disruptions, hacking, or technical issues may result in losses.
This information is not financial, investment, or trading advice. Consult a professional financial advisor before making decisions. We are not liable for any losses or damages arising from cryptocurrency futures trading.
Note: Ensure compliance with local regulations regarding cryptocurrency trading in your region.
thanks for like and follow @ydnldn to have more information outlook and free signal.
About me :
"I am a passionate swing trader focused on analyzing financial markets to capture profit opportunities from medium-term price movements. With a disciplined approach and in-depth technical analysis, I concentrate on identifying trends, support-resistance levels, and price patterns to make informed trading decisions. I prioritize strict risk management to protect capital while maximizing profit potential. Always learning and adapting to market dynamics, I enjoy the process of refining strategies to achieve consistency in trading."
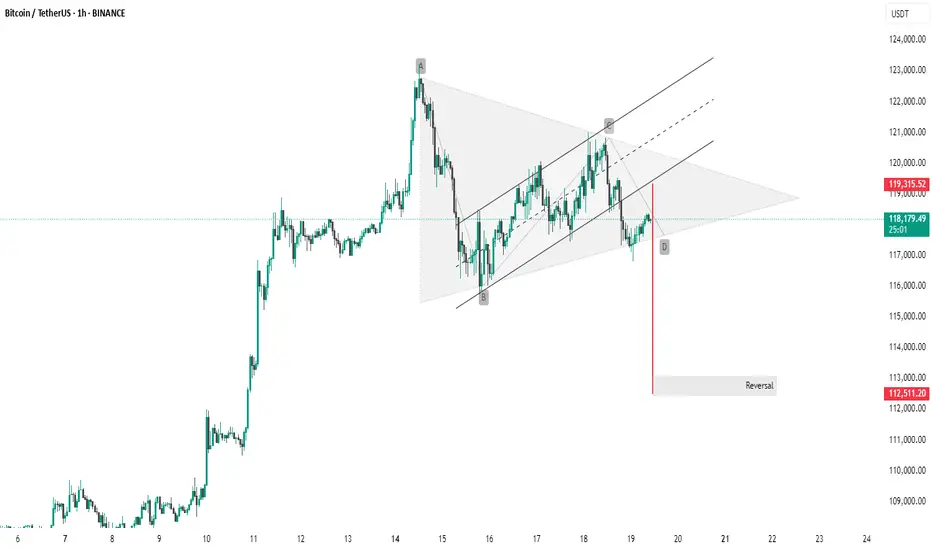
BTC #Bitcoin (BTC/USDT) 1-hour chartThis Bitcoin (BTC/USDT) 1-hour chart shows a bearish breakout from a symmetrical triangle or rising wedge pattern. The breakout is confirmed by a strong red candle below the lower trendline, suggesting downward momentum.
Pattern: Bearish wedge/triangle.
Breakout Level: ~118,000 USDT.
Target Zone: Around 112,511 USDT, marked as a potential reversal area.
Resistance: ~119,315 USDT.
This indicates bearish sentiment in the short term unless BTC quickly reclaims the upper trendline.
Thanking you
_Bitcoin Update
As you all know recently BTC just made a ATH record and aggressive move up panda fam right ? 🚀
Now bitcoin is consolidating or moving sideways in this structure panda fam same time altcoins are moving crazy upwards like altszn 🤯🚀
GOOD NEWS : Bitcoin is forming a possible good bullish structure for continuation pump panda fam, First confirmation will be break on trend resistance and reclaim above NEW ATH.
TAKE NOTE : As long as we are inside on the structure its still consider as sideways panda fam or ranging in short undecided directional bias. ✍️

BTC Pullback Near 200 EMA – Bounce or Breakdown?Bitcoin is currently undergoing a measured pullback after its recent push toward $121K. On the 1H timeframe, price has tested the 200 EMA and held so far, forming a short-term support near $117K. This aligns with a prior consolidation area and is showing some early signs of bottoming.
On the 4H chart, price is also consolidating after a healthy run-up. While momentum has cooled, BTC remains above key moving averages. RSI is approaching mid-range levels (~48), and the QQE is lightly bearish but not aggressive.
Key Zones to Watch:
Support (1H + 4H confluence):
🔹 $117,000 – $117,300 (EMA 200 + historical pivot + bounce region)
Resistance/Breakout Target:
🔹 $118,500 – $119,500 → Area where shorter EMAs are clustered
🔹 $121,000 → Previous local high
Take Profit (if bounce plays out):
🔹 TP1: $119,200
🔹 TP2: $120,800
🔹 TP3: $122,800
Scenarios:
Bullish Bias (if price reclaims $118.5K+):
Reclaiming EMAs and printing higher lows would suggest continuation.
RSI crossing 50 and increasing volume would confirm short-term bullish momentum.
Bearish Bias (if $117K breaks):
Breakdown from this base could send BTC to test $116K or even back to $114.5K range.
Look for volume spike + MACD/QQE confirmation for further downside.
Summary:
BTC remains in a constructive uptrend on higher timeframes. The current pullback is still within normal range, especially while price respects the 200 EMA on both 1H and 4H charts. This is a key decision zone—bulls want to see a reclaim of $118.5K, while bears need to break below $117K to take control.

BTC/USDT (1H) Market Analysis – July 19
BTC is hovering just below the 200 EMA, having recently bounced off it with a small recovery candle.
The recent downtrend from the $121K peak has flattened, and price is forming a potential short-term base above the $117K support.
There's low-volume chop, suggesting indecision or a pause before the next leg.
Key Technical Levels
Support zone: $117,200 – $117,500 (200 EMA + recent wick support)
Resistance zone: $118,500 – $119,000 (cluster of short EMAs + prior supply)
Breakout level: $119,500 (for a bullish continuation)
Breakdown level: $116,800 (for further downside)
Indicator Insights
RSI: 42.86 and curling up slightly → shows a potential recovery attempt but still below neutral.
QQE MOD: Deep in bearish territory (–8.53), but we’re seeing the first signs of easing negative momentum.
ATR: 681 and gradually falling → declining volatility, aligning with consolidation.
Bias & Scenarios
Bullish Case:
If BTC holds above the 200 EMA and breaks above $118.5K with volume, we could see a retest of the $119.5K–$120K zone.
RSI breaking 50 and QQE printing lighter red would confirm upward momentum.
Bearish Case:
Failure to reclaim EMAs and a drop below $117K could send price toward $116K or even back to the breakout base at $114.5K.
Watch for volume spikes on red candles and RSI breaking back under 40.

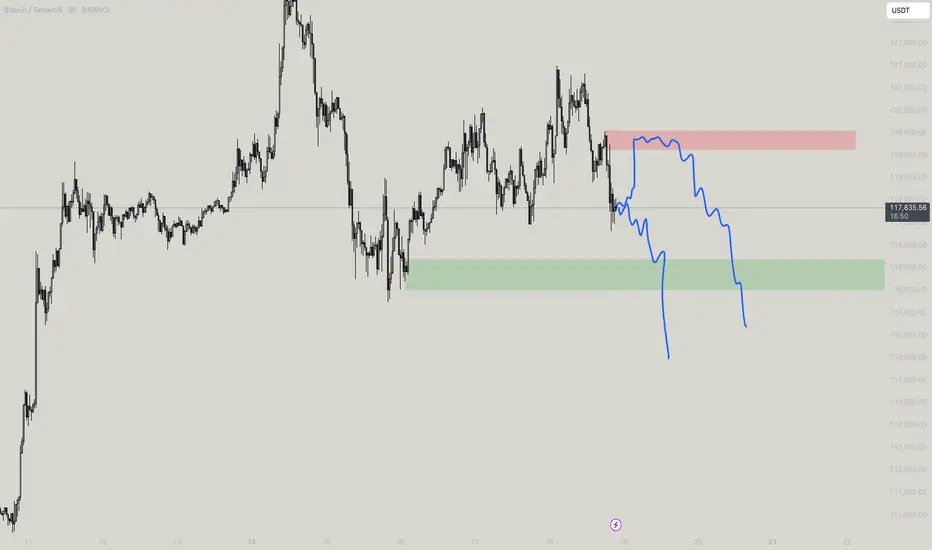
BTC - local situation (1h) SHORT🔻 Breaking down from a bearish pattern.
I expect a local decline to $114,000 - $112,000 on the 1h timeframe.
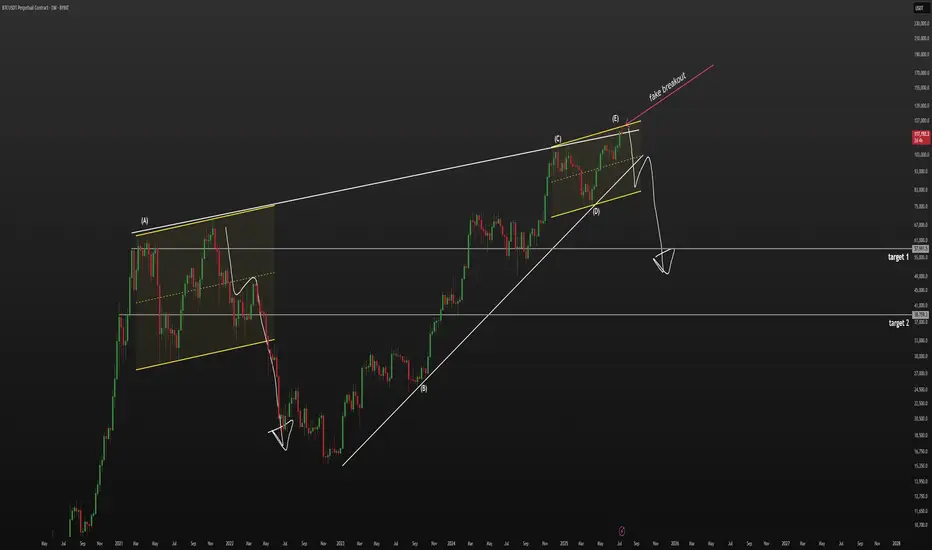
BTC - bearish wedge, 60k$ not a joke🔻 Globally, we are in a bearish wedge.
The price made a fake breakout and currently looks weak. On the 1D timeframe, we’re in an ascending channel similar to what we saw in 2021. Back then, after making a second higher high, the price sharply reversed downward.
📉 I believe the relevant downside targets are $60,000 and $40,000.
🔺 I’m currently in a short position, with a stop at $125,333.
2RRI believe bitcoin is eventually making a new local lower low, however, that it will likely bounce off the indicated range first, moving up in a three wave move before continuing lower. Well, the target may need to be adjusted, the indicated trade is attempting to take advantage of this Analysis.
BTC - 115 - 113k when?Looks likely today or tomorrow, Just in case if it traps you know how it can and if not you know the fall!