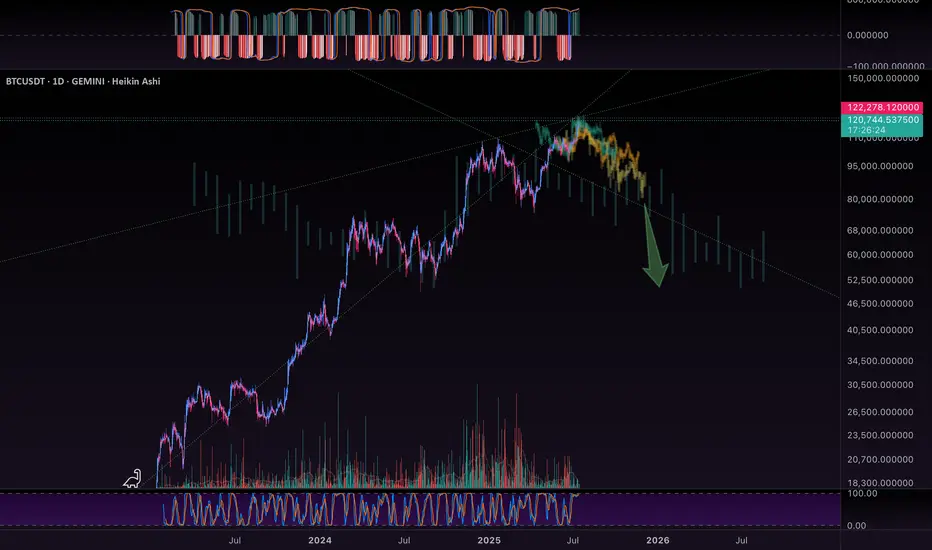
$BTC All Eyes on the FVG Zone. CRYPTOCAP:BTC broke out above key resistance and is now retesting the FVG zone near $112K–$115K.
Holding this level could trigger a fresh rally toward $127K–$132K.
DYRO, NFA
BTCDOWNUSDT trade ideas

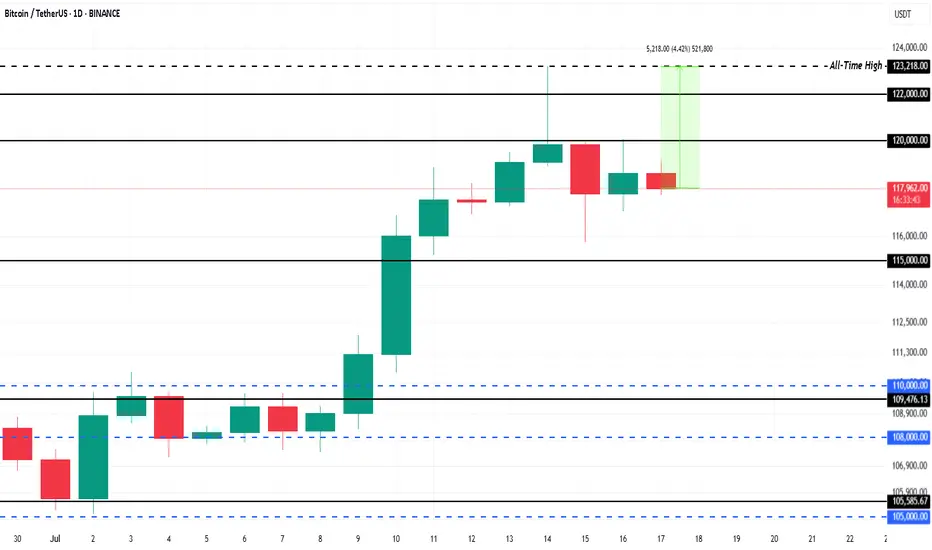
$1.5 Billion ETF Inflows Could Push Bitcoin Price 4% to New ATHBINANCE:BTCUSDT is currently trading at $118,325, facing resistance at the $120,000 level. This resistance is crucial for Bitcoin if it wants to break back to its ATH of $123,218 . The 4.4% gap to reach the ATH indicates potential for growth, but Bitcoin needs to secure support above $120,000 for this to happen.
This week, spot BINANCE:BTCUSDT exchange-traded funds (ETFs) saw over $1.5 billion in inflows , a significant portion of which occurred in the last 48 hours during Bitcoin’s dip.
The influx of institutional money highlights that investors are confident in Bitcoin’s potential despite the market cooling. If this trend persists, it could propel BINANCE:BTCUSDT price upward, as institutional support provides stability.
If BINANCE:BTCUSDT can hold above $120,000 and push past $122,000, it could continue its ascent toward new all-time highs. The current market conditions and ETF inflows support a bullish outlook, with a significant chance of breaking the resistance.
However, the risk of profit-taking remains , which could lead to a price drop. If BINANCE:BTCUSDT faces selling pressure, it could fall back to $115,000 , erasing a portion of recent gains. This would invalidate the bullish thesis, causing Bitcoin to retest lower support levels.
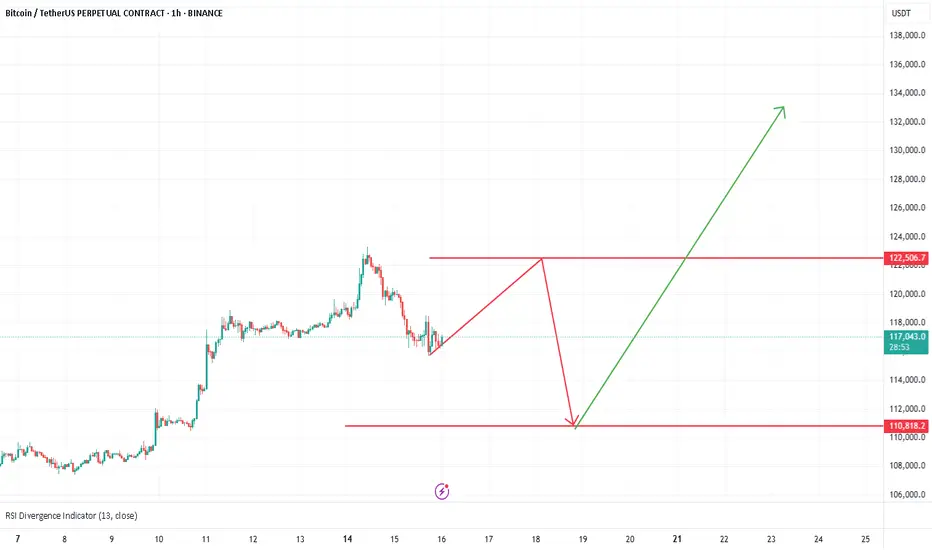
SELL BTC 13.7.2025 (scalping M15)Counter-trend trade order: SELL at THE TOP
Type of entry: Limit order
Condition:
- If the price break down at 122,041 confirming the down trend.
Note:
- Management of money carefully at the price of bottom (122,041)
Set up entry:
- Entry sell at 122,821
- SL at 123,334
- TP1: 123,041
- TP2: 121,389
Trading Method: Price action (No indicator, only trend and candles)


BtcUSDTafter btc create new all time high, to tell us that the uptrend continue, i will like to see a temporary pull back to around 110k to join the bull run again. trading a pull back can be risk.
but no risk no win. trade what you see

Analysis no 74 1hWelcome to king btc 3 Bitcoin is expected to decline from the range of 119,000 to 120,000 slowly to 113,500 and then rise to 125,000 in the cycle. The larger range is expected to be in the range of 115,500 to 125,000 which could be an opportunity for altcoins to rise. This is just a possibility.

Bitcoin breaks through $120,000Bitcoin breaks through $120,000: long opportunities under the resonance of fundamentals and technical aspects
I. Fundamentals: Multiple positive factors drive the bull market
Institutional funds continue to pour in
The net inflow of US spot Bitcoin ETFs reached US$2.7 billion in a single week (a single-week record in 2025), and BlackRock IBIT's management scale is close to US$100 billion410.
Listed companies (such as MicroStrategy) continue to increase their holdings, with a total holding of more than 850,000 BTC, worth nearly US$100 billion6.
Policy easing expectations strengthen
The US "Cryptocurrency Week" deliberates on three key bills (the "GENIUS Act" and the "Clarity Act", etc.). If passed, it will clarify the regulatory framework and eliminate market uncertainty210.
The Trump administration promotes crypto-friendly policies, including the "National Strategic Cryptocurrency Reserve" plan, to boost market confidence69.
Macroeconomic environment support
Expectations of Fed rate cuts are rising, funds are flowing into risky assets at an accelerated pace, and Bitcoin's safe-haven properties as "digital gold" are strengthened13.
2. Technical aspects: Breaking through key resistance, upward space opens
Key breakthrough confirmed
Bitcoin breaks through the $120,000 mark, completely gets rid of the $90,000-110,000 oscillation range, and forms a daily level "ascending triangle" breaking through 210.
RSI (daily) is in the healthy range of 60-70, no overbought signal appears, MACD golden cross continues, showing strong upward momentum 69.
Support and target
Short-term support: $118,000 (previous high conversion support), if it falls below, look at $112,000 (20-day moving average).
Upward target:
Short-term: $135,000-140,000 (Fibonacci extension level + institutional bullish consensus) 910.
Medium- to long-term: $200,000 (forecast by Standard Chartered Bank, Bitwise and other institutions) 48.
Derivatives signal
Short positions intensify the rise: $740 million of short orders were liquidated within 24 hours, forming a "short squeeze" positive feedback 26.
The options market is piled with bullish bets, and the open interest of $150,000 call options expiring in December has surged by 10.
Long-term ideas, entry strategies
Positions can be opened in batches at the current price (around $120,000), with a stop loss set at $115,000 (key psychological support).
If it stabilizes in the range of $118,000-115,000, you can increase your position.
Target and risk control
First target: $135,000 (technical resistance + institutional consensus).
Second target: $150,000 (trend continuation + policy catalysis).
Be wary of short-term fluctuations: If it falls below $115,000, the trend needs to be re-evaluated.
Configuration suggestions
Main position is Bitcoin, and auxiliary position is Ethereum (ETH breaks through $3,000, with great potential for catch-up) 10.
Avoid high leverage, and pay attention to the volatility that may be caused by the implementation of US regulatory details in August 18.
Conclusion: Bitcoin is driven by policy, capital, and technology, and the bull market pattern is clear. There may be short-term fluctuations, but the trend has not changed, and buying on dips remains the main strategy.
BTC AI Prediction Dashboard - 6h Price Path (16.07.25)
BTCUSDT Forecast:
Crypticorn AI Prediction Dashboard Projects 6h Price Path (Forward-Only)
Forecast timestamp: ~10:15 UTC
Timeframe: 15m
Prediction horizon: 6 hours
Model output:
Central estimate (blue line): -119,635
Represents the AI’s best estimate of BTC’s near-term price direction.
80% confidence band (light blue): 119,101 – 119,820
The light blue zone marks the 80% confidence range — the most likely area for price to close
40% confidence band (dark blue): 118,473 – 120,801
The dark blue zone shows the narrower 40% confidence range, where price is expected to stay with higher concentration
Volume on signal bar: 153.73
This chart shows a short-term Bitcoin price forecast using AI-generated confidence zones.
Candlesticks reflect actual BTC/USDT price action in 15-minute intervals.
This helps visualize expected volatility and potential price zones in the short term.

BTC/USDT, 1H chart, Futures - Bearish projection.the price looking for high areas without time in the SQZ minitor or strength, I hope that during the morning today it will fall and begin its journey to low areas between $115,500 and $114,500.

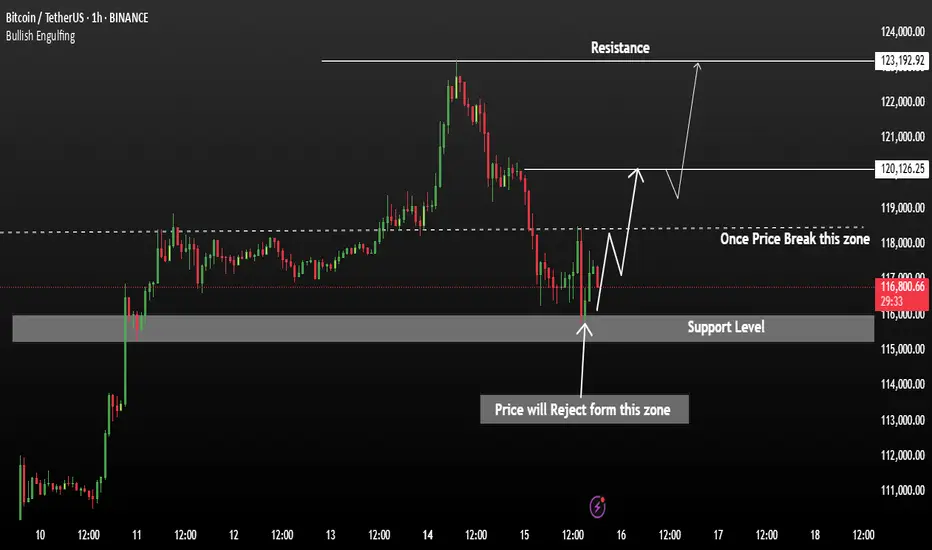
Bitcoin Price in Clear Bullish TrendBTCUSDT has formed a strong support zone around 115,500, where the price recently faced rejection, signalling potential bullish momentum. This zone is acting as a solid base, and any sustained move above the current levels could trigger an aggressive upward move.
Breakout Confirmation: A 1H candle close above 118,500 would confirm bullish continuation Upside Targets: 120,150 and 123,200,
A successful breakout above 118,500 could open the path toward 120K investor needs to monitor our chart.
PS:: Support with like and comments for more better analysis Thanks.
Phemex Analysis #97: What's Next for Bitcoin, After $123k?!Bitcoin ( PHEMEX:BTCUSDT.P ) recently made history by hitting an all-time high of $123,251 on July 14, 2025. However, enthusiasm was quickly tempered as BTC retraced by approximately 6%, dropping sharply to around $115,696 on July 15. Currently, the price has partially recovered and is trading at about $118,200.
With the market sentiment at a pivotal juncture following this volatile movement, traders and investors are carefully considering their next steps. Let's dive into several possible scenarios that might unfold in the coming days.
Possible Scenarios
1. Bullish Continuation (Breakout Above $123k)
If Bitcoin quickly regains bullish momentum, it may retest and surpass its recent high at $123,251. Breaking decisively above this resistance could trigger another strong rally, driven by renewed market optimism and potential institutional inflows.
Pro Tips:
Entry Strategy: Look to open or add to existing positions upon confirmation of a clear breakout above $123,251, especially if accompanied by high trading volume.
Profit Targets: Key resistance zones for profit-taking after a breakout include psychological levels at $128,000, and the significant milestone at $130,000.
Risk Management: Use protective stop-loss orders placed below the recent low around $115,000 to manage downside risks effectively.
2. Extended Consolidation (Range-Bound Scenario)
Bitcoin could enter a period of price consolidation, fluctuating between support at approximately $115,000 and resistance near $123,000. This scenario often occurs when the market awaits clearer directional cues.
Pro Tips:
Range Trading: Employ a grid-trading strategy, placing buy orders near support ($115,000–$116,000) and sell orders around resistance ($122,000–$123,000) to maximize profits from short-term volatility.
Monitoring Indicators: Keep an eye on declining trading volume, which often signals the potential for an upcoming breakout or breakdown.
3. Bearish Pullback (Correction Scenario)
Given the rapid recent surge to all-time highs, a deeper market correction remains possible. If BTC decisively breaks below support at $115,000 with strong selling pressure, further declines towards $107,218 or even $98,132 could ensue, especially if accompanied by negative broader market sentiment.
Pro Tips:
Short Opportunities: Experienced traders might explore short positions if BTC convincingly breaks below the $115,000 support level.
Accumulation Strategy: Long-term investors can strategically accumulate positions around significant lower support levels such as $107,218 and $98,132, provided price stabilization signals are evident.
Conclusion
Bitcoin is currently at a crucial technical and psychological level after hitting its latest all-time high. Traders should closely monitor the outlined scenarios—particularly watching key resistance at $123,251 and essential support at $115,000. By utilizing disciplined risk management, proactive profit-taking strategies, and careful market analysis, investors can effectively navigate BTC’s ongoing volatility and strategically position themselves for the next significant move.
🔥 Tips:
Armed Your Trading Arsenal with advanced tools like multiple watchlists, basket orders, and real-time strategy adjustments at Phemex. Our USDT-based scaled orders give you precise control over your risk, while iceberg orders provide stealthy execution.
Disclaimer: This is NOT financial or investment advice. Please conduct your own research (DYOR). Phemex is not responsible, directly or indirectly, for any damage or loss incurred or claimed to be caused by or in association with the use of or reliance on any content, goods, or services mentioned in this article.
BTC Weekly Update -as of Jul14🕰 Timeframe:
📆 Date:
🔎 Market Overview:
💼 Massive Institutional Inflows:
▪️ Over $1.1 billion in net capital inflows have entered spot Bitcoin ETFs in recent days, bringing the total weekly inflows to $2.72 billion so far.
▪️ The total assets under management (AUM) across all Bitcoin ETFs now exceed $150 billion, representing over 6% of Bitcoin’s total market capitalization.
⚖️ Favorable Political and Regulatory Support:
▪️ The ongoing Crypto Week in Congress is reviewing key legislative proposals like the Genius Act and the Clarity for Digital Assets Act, both of which offer promising regulatory clarity for the crypto industry.
▪️ Additionally, former President Trump’s executive order to establish a “Strategic Bitcoin Reserve” signals strong official political support for Bitcoin adoption.
📊 On-Chain & Sentiment Indicators
📦 Exchange Reserves:
Bitcoin reserves on centralized exchanges are at their lowest levels in years, suggesting a trend toward long-term holding (HODLing) and reduced selling pressure.
🧠 Fear & Greed Index:
The sentiment index remains firmly in the “Greed” zone, even hitting its highest level since May, indicating strong bullish sentiment among retail and institutional investors.
🌀 Whale Activity:
Whale wallets continue to show heavy accumulation, with large and steady transfers into private wallets, further supporting a bullish on-chain trend.
📈 Technical Setup
🔵Trend: Ranging upward
🔸 Key Support: 118,000➖ 115,000
🔸 Key Resistance: 125,000➖ 130,000
🔸 Indicators Used: RSI above 70
🧭 Next Week – Key Points
🔹 Watch for the outcomes of Crypto Week legislation in Washington — this will be a key driver for market direction.
🔹Monitor ETF capital inflows — if daily inflows stay above $500M, the bullish trend will likely strengthen.
🔹 Track the Federal Reserve's interest rate policy and the USD outlook, especially in response to inflation or other macroeconomic factors.
🔚 Summary: Final Analysis
📌 After reaching a new all-time high above $122K on July 14, Bitcoin’s bullish trend has strengthened. Strong institutional inflows and political support have reinforced the foundation for growth.
● Key Level Ahead: $125,000
● Outlook: If price consolidates above resistance, we could see a move toward $135K and beyond.
● Weekly Bias: Bullish, with potential for a pullback before continuation upward.
✅ If you like this analysis, don't forget to like 👍, follow 🧠, and share your thoughts below 💬!

BTC - Topping outWow.. and look at those beautiful harmonic pattern fits! My eyeballs are so pleased with my work! Hehe!
These aggressive monsters like to propagate and fractal…
I met with another wizard of the charts yesterday… forecasted BTC to $5,000 !!! Holy crap!
Are you getting FEARFUL yet? Or still feeling GREEDY?
This is gonna be fun!
Check my linked idea for more insights.
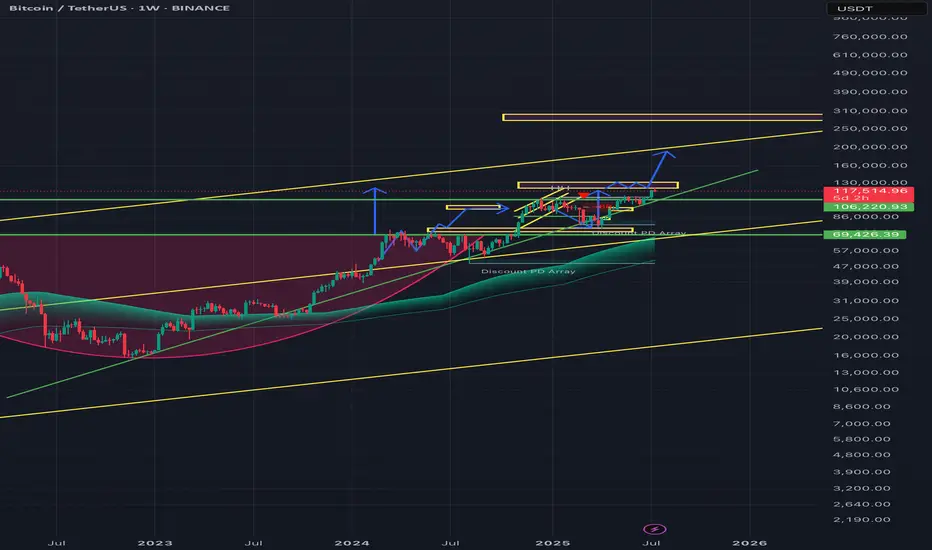
Bitcoin Analysis – 2W Timeframe
📌 As long as price holds above $113K, the trend remains bullish.
🎯 Next targets:
• T1: $151,635
• T2: $175,596
🔍 Any pullback toward $113K is a buying opportunity in a strong uptrend.

BITCOIN PULLBACK 110.000🔹 The uptrend remains intact
After setting a new high, the price may enter a mild correction toward the $110K zone.
Key support levels in this uptrend are:
✅ $115K
✅ $110K
✅ $105K
As long as the price holds above $105K, any pullback is considered healthy and the uptrend is likely to continue.
📊 A shallow correction is part of a healthy market structure.

More up📈 Trading Tip – Long Position on Bitcoin (BTC)
As of today, Bitcoin is trading around $117,395, after retreating from an intraday high of $120,196. The price action follows a recent rally toward $123,000, followed by a healthy correction to the $116,000 area.
Technical Overview:
• The resistance zone at $119,000–$120,000 has been broken and could now act as future support.
• A potential inverse head and shoulders pattern is forming, suggesting a breakout toward the $160,000 level, if the support at $114,000–$115,000 holds.
• On the 4-hour chart: MACD is showing a renewed bullish crossover, and RSI is rising steadily without entering the overbought zone — both supporting further upside toward $125,000–$130,000.
🔹 Suggested Entry: Between $117,000 – $118,000, ideally after confirmation of support near the previous breakout zone.
🔹 Target 1 (TP1): $125,000
🔹 Target 2 (TP2): $130,000–$135,000 (depending on momentum continuation)
🔹 Stop Loss (SL): A confirmed break below $115,000 (preferably on the daily close or with strong sell pressure)
⚙️ Risk Management: Do not risk more than 2–3% of your total capital on this trade.
📅 Watchlist Note: Keep an eye on major economic data (e.g., U.S. CPI or Fed announcements) as they can heavily affect market liquidity and volatility.
Btc chartBtc harmonics chart.
Price should go up to hit 122k to form a bearish pattern, if the pattern will not get invalidated the target area is around 100k - 98k, and that will form a bullish harmonics pattern that will push the price to 132 - 137k and above, if 100k will hold support.
PVSRA Bitcoin AnalysisMay 08 2025 a bullish candle's parallel volume bar broke the threshold in the below pane; indicating price instability, or unfilled orders if you will. June 22 price returns to that full candle body and dips $500 below it, to feel the opposing force and realize orders have been filled and we are in equilibrium. This set up is usually set up and finished in 1-2 weeks (volume absorption) so this 1.5 month setup was an outlier and a grind that paid off BIG patience and knowing your plan of attack is everything in this game, you have to have a plan for every single variable and NEVER stray.
Present day, a 30 minute candle has broken our volume threshold, and weve moved aggressively away from that magnetic force inevitably pulling price back towards it EVENTUALLY as it did june 22nd. Due to the commonality and the recentness of the move that just happened of 5/8-6/22, we can suspect price pattern will repeat and price will be bid up, from 115-120k, where we will then reverse to 103. The bar pattern from the 5'8 6'22 move was copied, pasted, and retrofitted to current time.
Regardless of the exact pattern of the move we expect price eventually to resolve those orders at the 103 mark and our moves are based in that zone. This seems like a range out as we capitulate these 6 figures whilst remaining in a bull market.

BTC SHORT Price found resistance after exhaustive uptrend to 120K area.
Trend reversal taking place. Looks like more downside for now.

Don't take a short position BTCUSDT"Don't take a short position, but be prepared for a temporary drop before the market goes back to ranging. Right now, we're in one of the most exciting moments in the BTC market. "
BITCOIN UPDATEHello friends🙌
📈Given the upward trend we had, you can see that the price is in an upward channel and has also formed a bullish pattern, which, given the strength behind the trend, seems to have higher targets.
🔊Be careful, the basic principle of trading is capital management, so be sure to follow capital management.
🔥Join us for more signals🔥
*Trade safely with us*

BTC trading planBINANCE:BTCUSDT A full day has passed since my last update. We’re now witnessing a clear bull-to-bear reversal in market sentiment. The hourly RSI is deeply oversold, but the 4-hour RSI still has room to drop further. Price is aggressively targeting the weekly pivot at $115,334. With the local trendline and the $119K level broken, the orange scenario is now in motion. A short pullback is possible before the next leg down toward $110K. For details, see yesterday’s video
Trade safe and stay adaptive

BTC Analysis — Long-Term Buy Zone AheadI'm watching $111,000 as a major buy zone on Bitcoin.
If price retraces to that level, I’ll be ready to enter a long position.
This is not a prediction — it’s a scenario.
Smart traders don’t guess, they prepare.
Let price come to your level. No chasing.
📍Set your alerts and stay patient.
