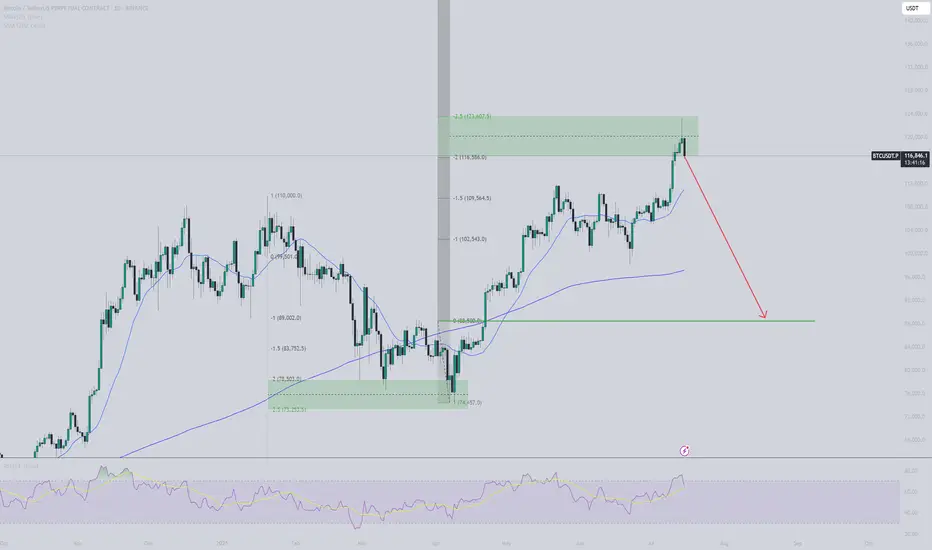
BTC retracement comingBTC seems to follow the 2-2,5 stdv price structure. Based on simply stdv from last manipulation leg down it suggests we are now at reversal zone, and I expect price to retrace down. First reaction seems to support this plan. Aiming at $88,5K.
BTCDOWNUSDT trade ideas
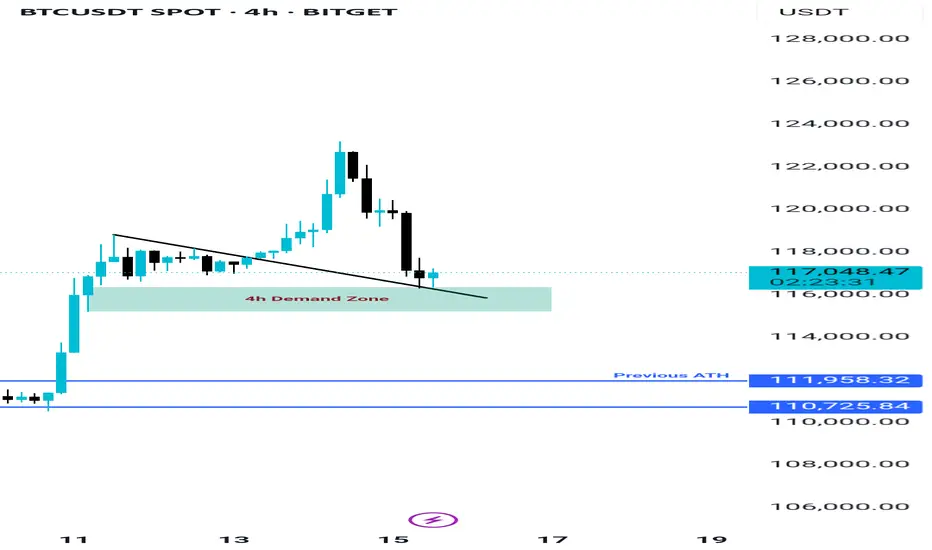
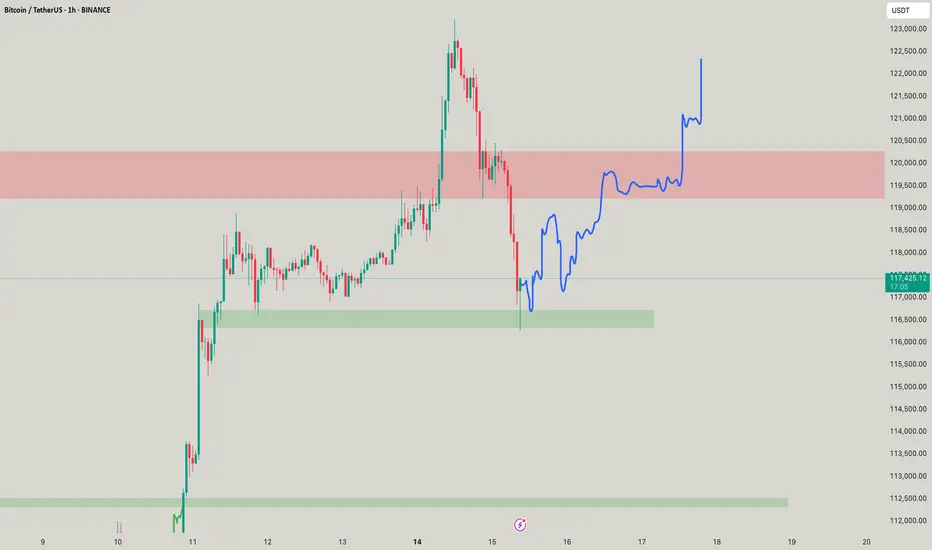
BTC still Holding the Demand Zone, Bitcoin is currently holding the demand zone between $116K and $117K, which also aligns with the retest area of a previously broken trendline—making this zone quite strong. If BTC manages to close above $117.8K on lower timeframes, we could see the beginning of a new uptrend targeting around $130K. However, if this zone fails due to any unexpected news or events, the next key support lies between $111K and $113K.

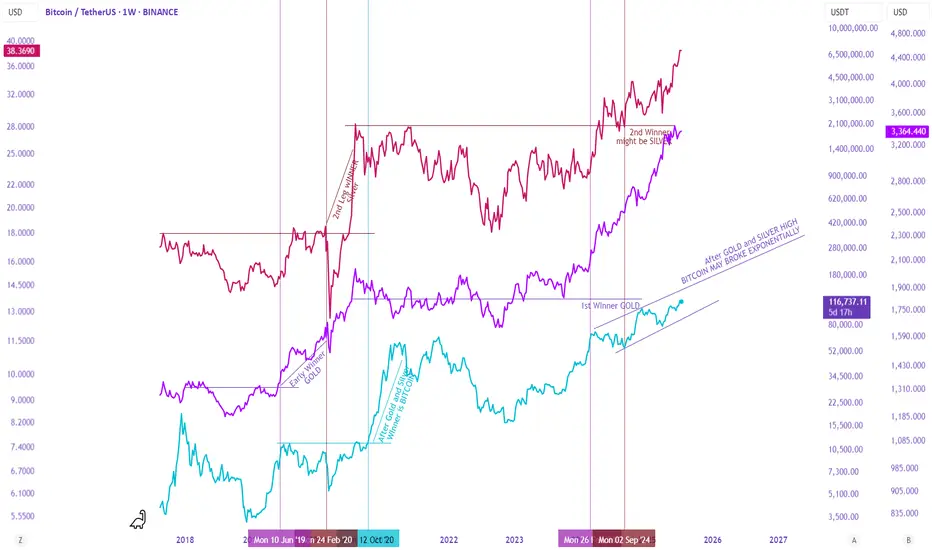
Gold, Silver, and Bitcoin – A Staggered Anti-Currency Rotation?There seems to be a complex yet recurring relationship between Gold, Silver, and Bitcoin during anti-currency phases (when fiat weakens).
First Leg – Gold Leads
Gold typically leads the first leg, breaking out to new highs. Silver follows but lags—trending up without breaking major resistance. During this phase, the Gold/Silver ratio expands.
Second Leg – Silver Takes Over
Eventually, Silver breaks resistance and becomes the second leg leader. As it outperforms Gold, the Gold/Silver ratio contracts back to mean.
Bitcoin, during this time, is usually bottoming or entering Stage 2 (early uptrend). This time, it has already broken resistance but is rising slower than in past cycles.
Third Leg – Bitcoin Dominates
As Gold and Silver peak and begin to correct, Bitcoin accelerates, often making new all-time highs (ATH).
This staggered rotation played out during the 2018–2022 cycle. Let's see if history rhymes in this cycle.
What i see, still normalBTC has now found resistance at the mid trendline, once this flips support we look for massive uptrend


BTC Bullish Setup: Two Long Positions Aligned for ContinuationHello guys!
Bitcoin is currently in a strong uptrend, consolidating after a sharp move up. The chart highlights a textbook bullish continuation pattern (pennant/triangle), suggesting momentum is building for another leg up.
Attention:
This is not an either-or setups. Both long entries are valid and could trigger one after the other, offering layered opportunities for bulls.
1- First Long: Breakout from Bullish Pennant
Price is tightening inside a triangle after a strong impulse move.
A breakout above the resistance around $118K would confirm continuation.
Entry on the breakout targets the upper liquidity zone near $122K.
2- Second Long: Pullback to S&D Zone (around $115K)
If the breakout happens and then retraces, watch for price to revisit the S&D zone at $115,200–$115,800.
This area will act as support and provide a second long opportunity.
target: around $122k

BitcoinBitcoin/TetherUS (BTC/USDT) Trading Analysis - Jul 15, 2025
Key Observations:
Price Movement:
Current Price: $117,692.46
24h Change: -2,148.72 (-1.79%)
Range: Low of $116,250.00 to High of $119,940.83
The price is currently near the lower end of the day's range, indicating bearish pressure.
Support and Resistance:
Support Levels:
Strong Support: $112,000.00 (marked as S/L)
Intermediate Support: $113,500.00 and $110,000.00
Resistance Levels:
Immediate Resistance: $119,900.00
Higher Resistance: $120,000.00 and $122,500.00
Profit Levels:
The "Profit" section lists potential take-profit targets, with the highest at $135,000.00.
The price has recently dipped below the $120,000.00 psychological level, suggesting weakening bullish momentum.
Trend Context:
The chart spans from June to September, but the current price action (July) shows consolidation after a potential pullback from higher levels.
The presence of multiple support levels ($112K–$116K) suggests a critical zone for buyers to defend.
Actionable Insights:
Bearish Short-Term: The price is below key levels ($119,900–$120,000) and has broken below $118,250.00. A retest of support at $112,000.00 is plausible.
Bullish Reversal Signal: If BTC holds above $112,000.00 and reclaims $120,000.00, it could target $122,500.00 or higher.
Risk Management: A break below $112,000.00 (S/L) may trigger further downside toward $110,000.00 or lower.
Conclusion:
The market is currently in a corrective phase. Traders should monitor the $112,000.00 support for potential reversals or breakdowns. A close above $120,000.00 would shift bias to bullish.

BTC - Can It go back to 123k - 124k?Yeaah IT CAN! Provided you know where it moves out, it have little imbalances at 115k as well so eye on it as well!
Bitcoin Rush: The Carnival and Concerns Behind $120,000Bitcoin Rush: The Carnival and Concerns Behind $120,000
The Bitcoin market is staging an epic rally - the price has broken through the $120,000 mark, setting a new record high. But behind this jubilation, the market has shown signs of overheating.
Market Status: Risks Hidden in the Frenzy
Price Performance: Hit a new high of $123,000 on July 15, up nearly 20% this year, with a total market value of $2.2 trillion (the fifth largest asset in the world)
Market Sentiment: Fear and Greed Index 72 (extreme greed), but more than 100,000 people were liquidated in 24 hours, with a loss of $510 million
Technical Signals: RSI reached 70.9 (overbought zone), and the 30-day unrealized profit and loss ratio reached the 80% percentile
Three major rising engines
Institutional entry
Spot Bitcoin ETF net inflow of $118 million in a single day (BlackRock holds more than 700,000 coins)
MicroStra Tegy's holdings value exceeds $50 billion
Trump Media Group and other listed companies join the "coin hoarding trend"
Regulatory support
The U.S. "Cryptocurrency Week" deliberates on three key bills
Hong Kong passes the "Stablecoin Ordinance" (effective on August 1)
The EU MiCA framework begins to be implemented
Macro support
The probability of the Fed's September rate cut is 72.3%
The weakening of the U.S. dollar + trade protection policies boost risk aversion demand
Bitcoin's positioning shifts from "speculative assets" to "digital gold"
Key technical signals
Breakthrough pattern: daily "three white soldiers" candle + ascending triangle breakthrough, target 128,000-132,000 U.S. dollars Yuan
Key position:
Support: $116,800 (near term), $112,000 (key)
Resistance: $121,500 (short term), $140,000 (long term)
Risk signal: H4 chart RSI reaches 77, MACD histogram shrinks
Future outlook
Short term: If the $112,000 support is maintained, it is expected to challenge $140,000
Risk: Falling below $108,500 may trigger a chain of liquidations
Cycle law: Referring to "peaking 550 days after halving", this round of bull market may peak in October
Breakout trading strategy (suitable for aggressive traders )
Entry conditions:
Price stabilizes above $123,000 with increased trading volume (at least 1.5 times the 20-day average volume)
4-hour chart closes above the previous high for three consecutive positive lines
Targets:
First target $128,000 (1.618 Fibonacci extension level)
Second target $135,000 (psychological barrier + upper channel track)
Stop loss setting:
Day trading: Falling below the $120,000 round mark
Swing trading: Falling below the $116,800 support platform
Conclusion: Bitcoin is writing a new chapter in history, but investors need to be wary of "extreme joy leads to sorrow". Remember: when others are fearful, I am greedy, and when others are greedy, I am fearful - this old saying always applies to the crypto market.

BTCUSDT - MOSTLY UPTREND DIRECTIONAll supply demand zone identified.
May breach till 110000$. Please do your own research before taking any trades
BTC bullish sentiment and All time highs?BTC is printing a good structure and characteristics resembling the highs of 2021. 2025 is the only bullish year left before BTC crashes again.
Usually BTC is bullish in the end of the year. This OCT/NOV could print 130K-136k for btc before a fatal crash

BTC Short Bitcoin needs a little correction from here for a healthy pump , I am in short postion now

Analysis of the Latest Bitcoin Market。On July 14, Bitcoin's price surged sharply, with the highest level reaching $123,100. This breakthrough ended its eight-month-long consolidation phase within the $90,000 - $110,000 range.
The U.S. House of Representatives designated the week of July 14 as "Crypto Week" and plans to deliberate on a number of key bills. Among them, the Guiding and Establishing America's Stablecoin National Innovation Act aims to formulate federal regulations for stablecoins and is regarded as a "landmark legislation" in the cryptocurrency sector. The market expects the cryptocurrency industry to usher in policy dividends.
Market analysts are relatively optimistic about Bitcoin's prospects. The $125,000 level is seen as the next key psychological threshold, and a breakthrough above it would open up greater upside potential. Standard Chartered Bank predicts that Bitcoin will challenge $200,000 by the end of the year. Although the Relative Strength Index (RSI) is at a high level, there is no obvious overbought signal. The moving average system is clearly aligned, and the support level has moved up to $112,000. The market consensus holds that "any pullback represents a buying opportunity."
you are currently struggling with losses,or are unsure which of the numerous trading strategies to follow,You have the option to join our VIP program. I will assist you and provide you with accurate trading signals, enabling you to navigate the financial markets with greater confidence and potentially achieve optimal trading results.
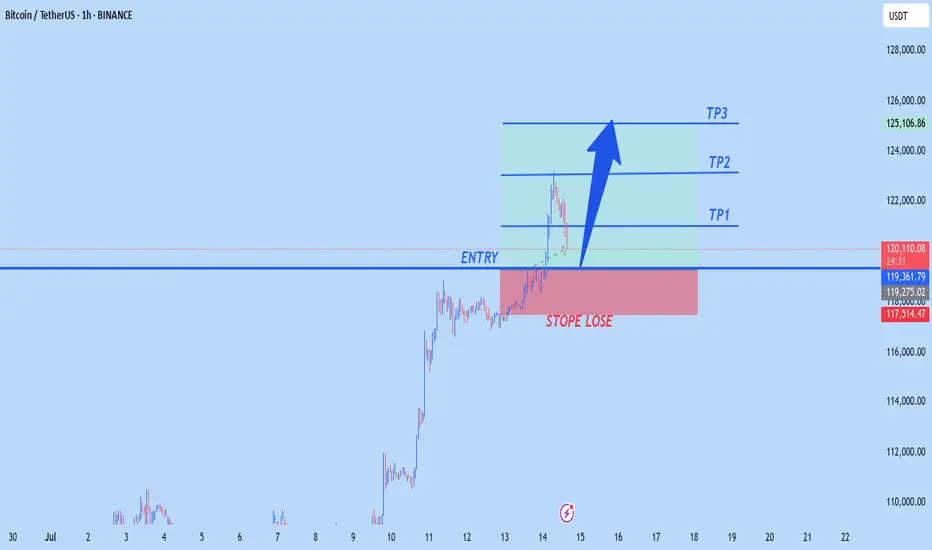
BTCUSD NEW OUTLOOKBtc buy from 119,000
TP1 122,000
Tp2 123,000
Tp3 125,000
STOPE LOSE 117,500
Trade at your own risk
$BTC RISING WEDGE ~ {LONG TERM VIEW}I don't feel like writing, everything is clear. Bitcoin is bullish right now, but keep an eye on this pattern.

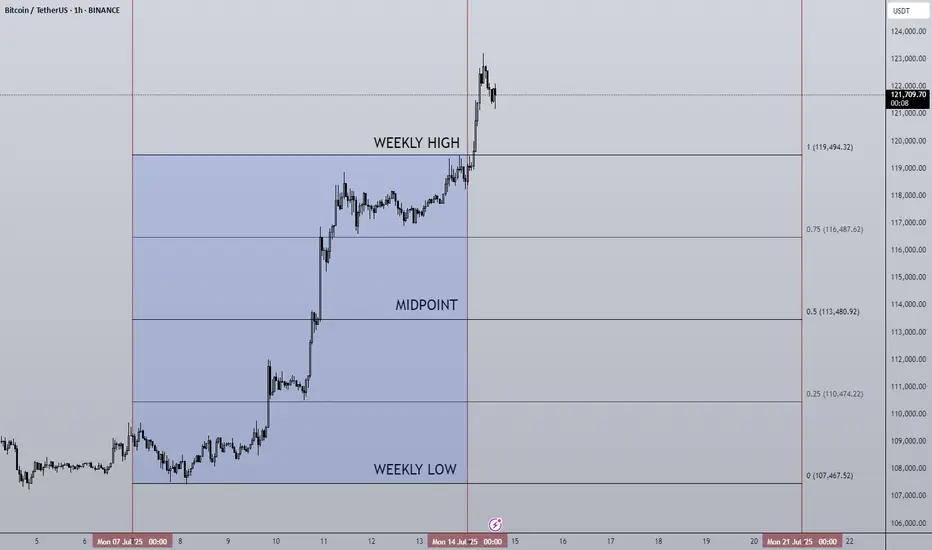
14/07/25 Weekly OutlookLast weeks high: $119,494.32
Last weeks low: $107,467.52
Midpoint: $113,480.92
NEW BTC ATH!
This is what we've all been waiting for, BTC breaks through resistance at $110,000-112,000 to set a the highest weekly close ever ($119,086). Thanks to a further $2.27B net inflows via BTC ETFs, the passing of the "big beautiful bill" flipping from a more deficit reduction stance by the US to an environment perfectly suited to risk on assets. Things are looking good for Bitcoin.
This week already in the Asia session BTC has broken above the weekly high to hit $123,100. Despite this incredible rally BTC.D has been falling since Thursday of last week. To me this signals altcoins have started to play catch up and we've seen that with ETH breaking $3000 (+14% relative to BTC).
I would like to see BTC consolidating here above the weekly high while altcoin majors break their choppy rangebound environments and shift to a trending environment just as BTC had last week.
There are also major data releases this week:
Tuesday CPI
Wednesday PPI
Thursday Euro CPI
Thursday US Initial Jobless Claims
I do not expect these data releases to have a major effect on the markets in their current state due to the risk appetite we've seen in both crypto and equities, such shallow pullbacks prove the demand is there to absorb and sell-side pressure for now.
Now is an excellent time to back strong projects with great fundamentals that are breaking out from downtrends/ranges in both their USD & BTC pairs, as BTC.D drops alts can print some great returns. Beta plays of ETH & SOL can offer higher returns than the majors themselves in these market conditions too.
Good luck this week everybody!
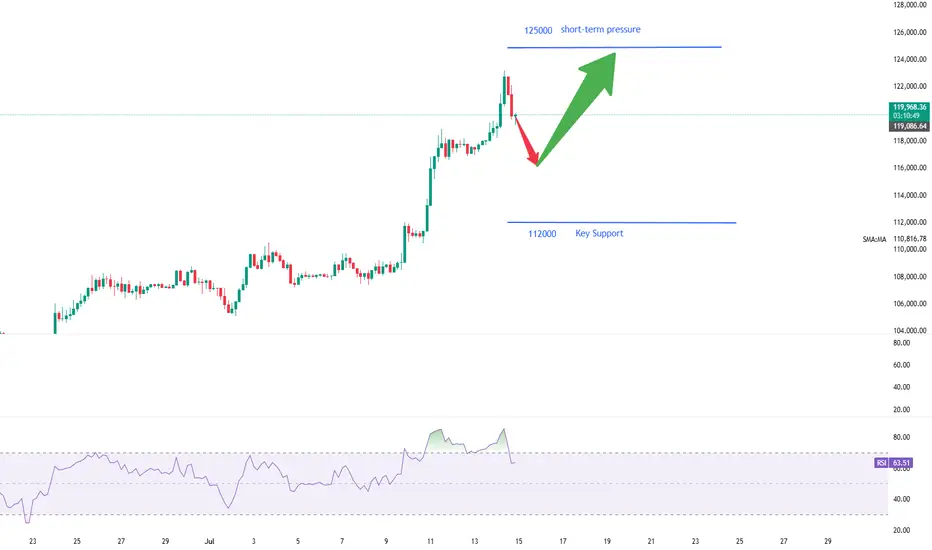
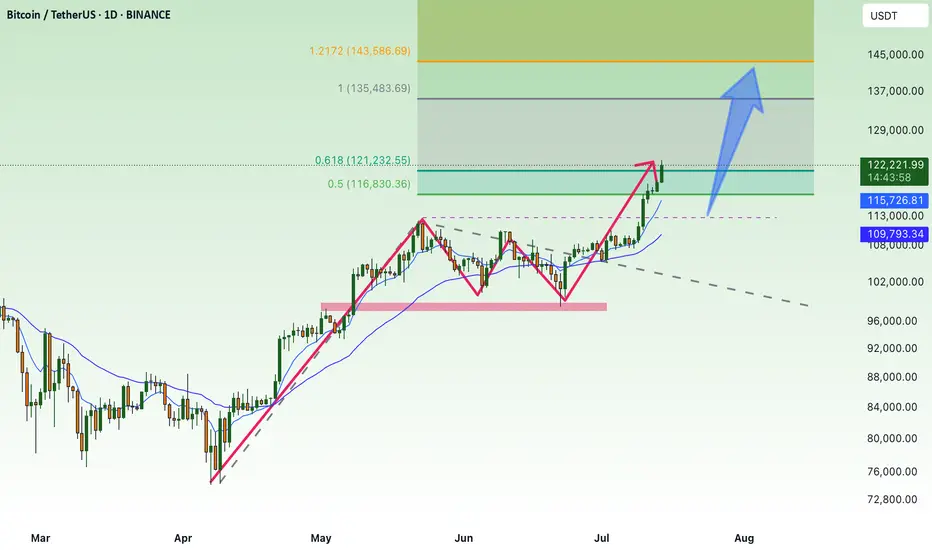
Can Bitcoin reach new highs?Bitcoin reached around 121722, close to the expected target of 130,000. There are two current expectations:
1. Black line: 5-wave rising structure, currently in the 3rd wave rising, and there will be a 5th wave rising after the correction.
2. Purple line: abc rising structure, currently in the last wave c rising, will end the rise ahead of time.
The rise is not yet complete. If it falls below the lower track of the channel, the rise will end.

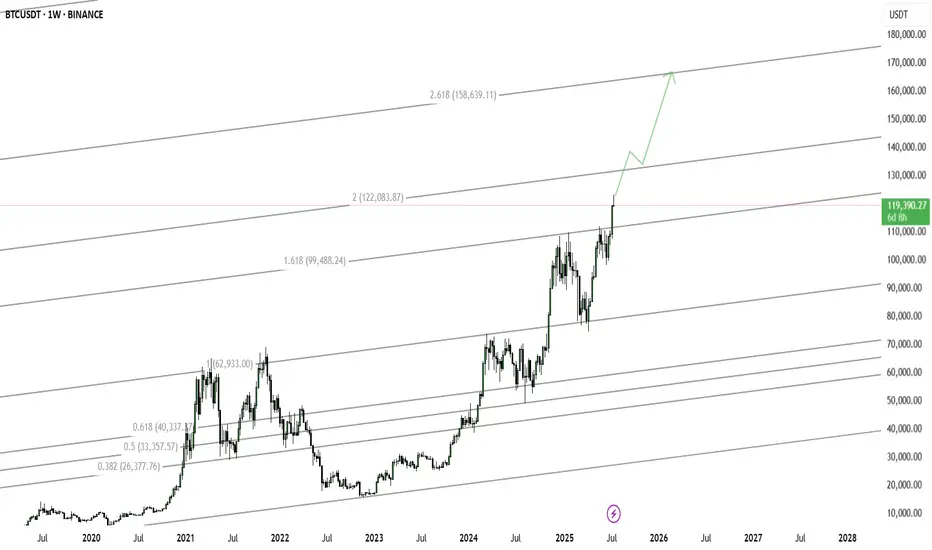
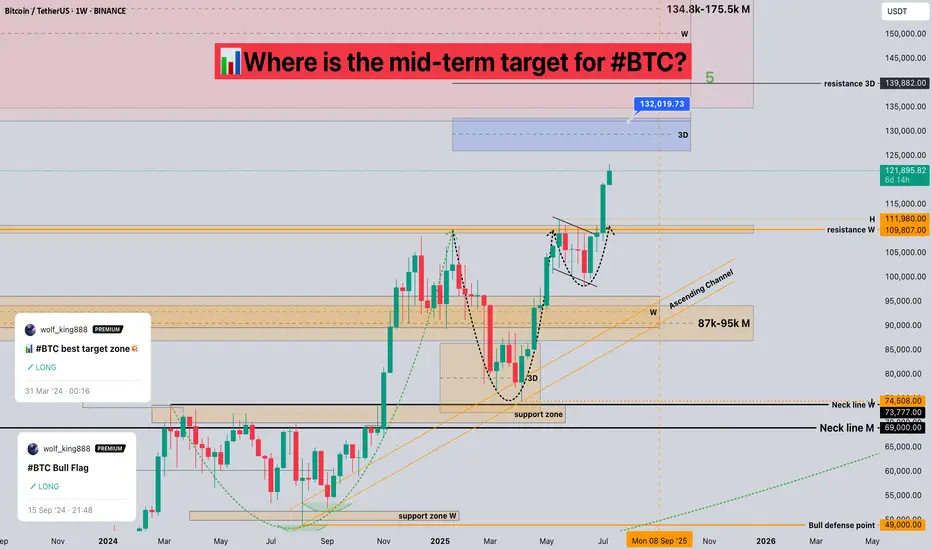
Where is the mid-term target for #BTC?📊Where is the mid-term target for #BTC?
🧠From a structural perspective, the bullish structure at the weekly and monthly levels is intact, so any increase is reasonable. We are approaching the target area of 132k-175.5k at the weekly and monthly levels. Please remember to lock in profits for spot trading.
➡️The weekly closing price is higher than the weekly resistance line, so the resistance line turns into a support line. If the price can return here again, you can look for bullish signals to participate in some long trades.
⚠️Short trading is a counter-trend trade, so we need to be cautious enough, and risk management is a must.
🤜If you like my analysis, please like 💖 and share 💬
BINANCE:BTCUSDT
BTC Era, continue to create new ATH💎 BTC WEEKLY PLAN UPDATE (14 July )
NOTABLE NEWS ABOUT BTC
Bitcoin (BTC) broke above a key milestone on Friday, setting a new all-time high of $119,999 with no signs of slowing down. The technical outlook supports further gains as momentum indicators remain strong and price action is solidly in price discovery mode, with the next potential target at $135.000
Bitcoin’s Next Stop: $135.000
Bitcoin entered price discovery on July 9, and since then, the king of cryptocurrencies has surged toward the $120,000 target—a key psychological level for traders. Early Monday during the Asian session, BTC climbed to a peak of $119,999, marking a new all-time high and the closest the asset has come to this milestone.
TECHNICAL ANALYSIS PERSPECTIVE
Two key momentum indicators on the daily timeframe signal underlying bullish momentum in Bitcoin, suggesting a potential for further upside. The Relative Strength Index (RSI) reads 76, and the Moving Average Convergence Divergence (MACD) is flashing green histogram bars above the neutral line.
However, if BTC undergoes a correction, it may extend its pullback to find support near the lower boundary of the Fair Value Gap (FVG) around $115,222.
Derivatives market data shows that $76 million was liquidated over the past 24 hours as BTC surged toward its new high. The long/short ratio, which is considered an indicator of bullish or bearish trader sentiment, is above 1—indicating that more derivative traders are optimistic about Bitcoin and are expecting further gains in the king of cryptocurrencies.
Stay tuned to the channel for updates.
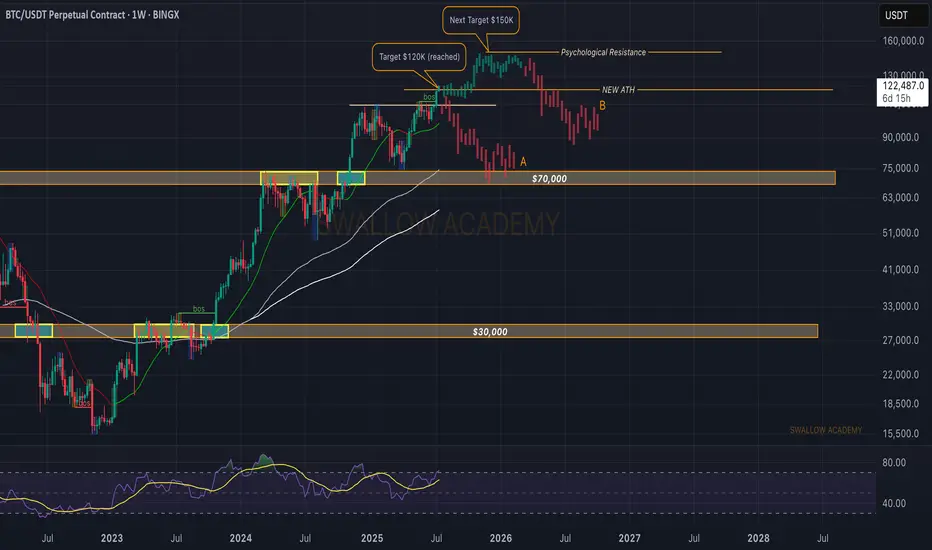
Bitcoin (BTC): Our Target Got Reached, Not Time To Just Watch!Buyers keep on pushing. As a new week starts, we are seeing a strong buy-side dominance and a new ATH to be formed, which broke our major target area of $120K.
Now to give a quick answer, our target is sitting at $140-150K, which we think will be the local top for this bull cycle, and as we recently reached major psychological resistance, we might see some sideways movement from here on, so there are a few things we are going to look for in order to get a potential trade from here.
1) Look for proper BOS (which should give us a good entry for long position)
2) if we see sideways channel, wait out for it to properly form on 30M timeframe, then try to trade inside the channel
3) If we see any kind of MSB (market structure break), we are going to look for a short position, as we might have a quick liquidity hunt there.
Swallow Academy
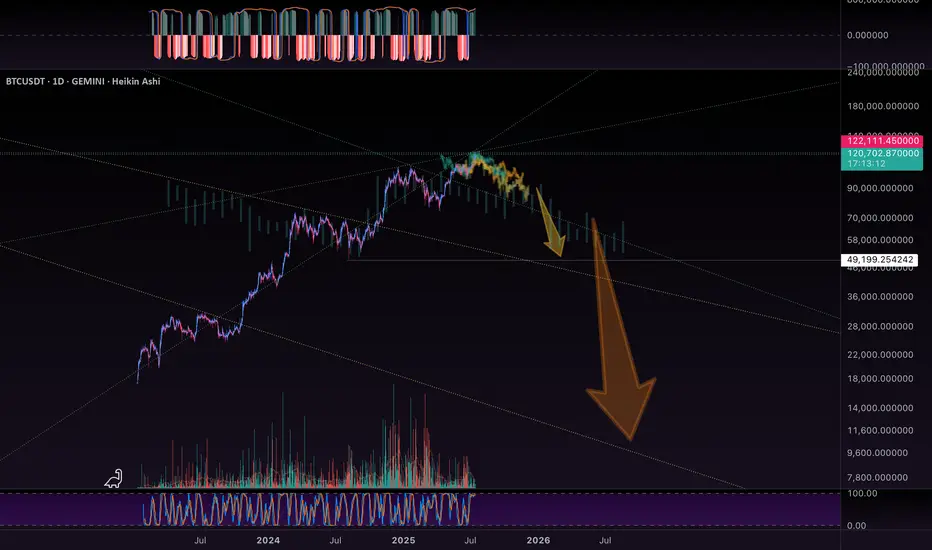
BTC - Historic Levels to CheckBTC has some checking in to do…. On historic resistance levels…
I drew in the major ones visible on this chart… and the initial bearish fractal, which was shown to us previously int he chart.
It will fractal for each arrow.
Pump and Dump!
Im going to run my DOGe.
See my linked post below for a bigger picture view of all this.