Why This Breakout Feels Like $29K and $48K – Big Moves Ahead?🤔📊 Why This Breakout Feels Like $29K and $48K – Big Moves Ahead? 🚀📈
Hey everyone! It’s Saturday, July 12th , and while the markets take a breather, it’s the perfect moment to zoom out and assess the bigger picture . Are we in for another retail weekend surge?
Let’s break it down 🔍👇
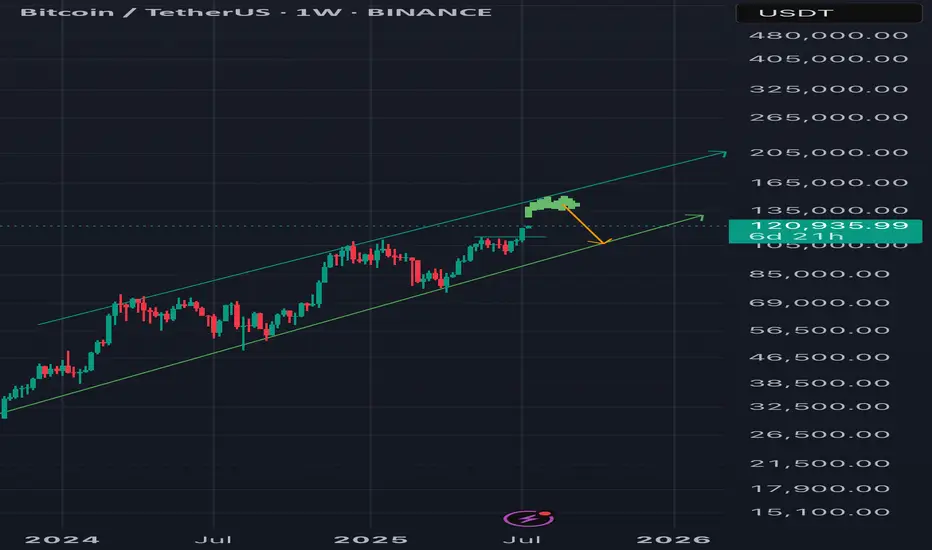
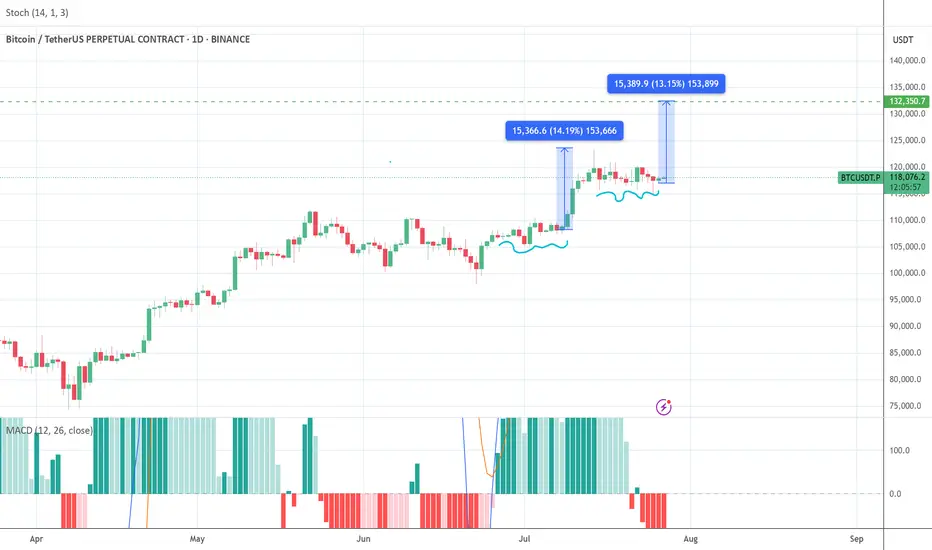
After closely analyzing the charts, one thing becomes clear — this breakout is structurally similar to the previous key breakouts at $29K and $48K. In both historical cases, price surged significantly without immediately retesting the breakout level.
➡️ Back in 2020, price exploded +144% above the yellow level before ever coming back to test it.
➡️ At $48K, a similar move of +49% occurred before signs of exhaustion and a retest emerged.
Fast forward to today: We've just broken above a massive ascending support zone — $114,921–$115K — and the market shows no intention of pulling back yet. This tells us something powerful: Momentum is in control.
💡 According to my technical roadmap, we may not see a retest of $115K anytime soon. Instead, the next target zone lies around $182K–$189K, depending on velocity and sentiment. With halving-to-ATH cycles historically lasting ~550 days, we’re well within that bullish window.
Remember the channel support/last entry right after the Iran-Israel ceasefire on June 23rd? That’s been a defining entry and it’s still playing out beautifully. So we wish for geopolitical stability and peace.
So, while it’s easy to feel left out — don’t short, don’t sulk. This may be our moment to ride the wave long. 🎯📉📈
One Love,
The FXPROFESSOR 💙
Disclosure: I am happy to be part of the Trade Nation's Influencer program and receive a monthly fee for using their TradingView charts in my analysis. Awesome broker, where the trader really comes first! 🌟🤝📈
BTCDOWNUSDT trade ideas

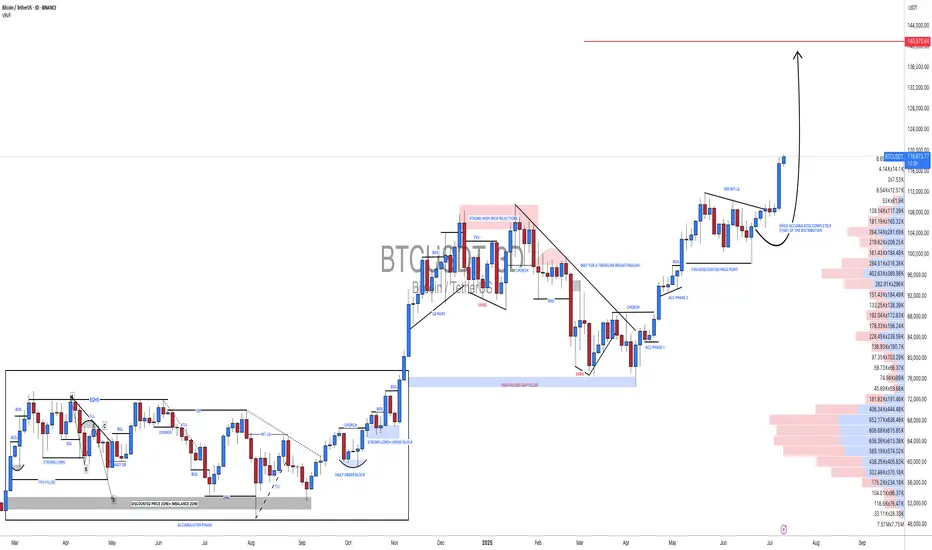
Btc usdt idea I think Btc will top around 140k and alt season will start at the distribution phase . we are so close for the money to start moving to the eth and other alts . pick wisely the time will arrive very quickly
#BTCUSDT[BITCOIN]: What Next Now For Bitcoin? We’ve published multiple analyses on Bitcoin, and as expected, the price has moved in line with our predictions. Now that it’s reached an emotional level of 120k, the main question is: will price hold on to the bullish volume and continue the bull move to the next target, which could be 130k or 150k? In our opinion, price will remain bullish until it touches the 130k region. At that point, we could see a short-term bearish correction for Bitcoin. Please do your own analysis and risk management.
Team Setupsfx_
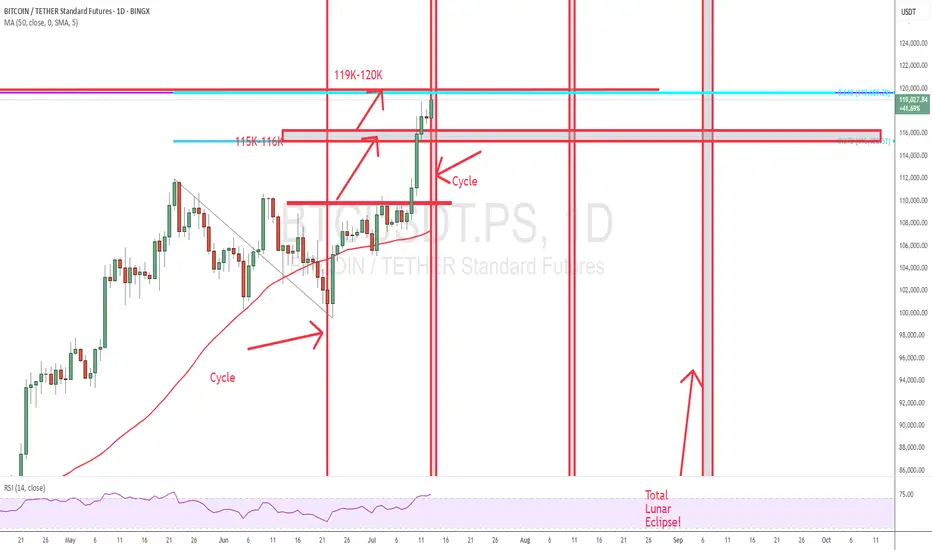
BTC updateFinally, BTC got to my price.
It came exactly to the price and Time (Cycle). Let's see if we clear that.
Good Luck
BTCUSDT Forming Strong BreakoutBTCUSDT is looking increasingly bullish as the pair continues to hold above its key support level, building a solid foundation for the next major leg up. The chart clearly shows a strong breakout pattern forming with higher highs and higher lows, signaling that the momentum is shifting in favor of the bulls. The well-defined support zone highlighted on the chart has repeatedly acted as a launchpad for buyers, making this area crucial for traders to watch closely. A breakout above the recent consolidation could open doors for a significant rally toward the 140% to 150% gain levels projected.
Volume for BTCUSDT remains robust, confirming the strong interest from both retail and institutional investors. This is a good sign because healthy volume typically precedes strong price action and follow-through. As Bitcoin continues to dominate the crypto market, it often sets the tone for the entire altcoin space, so a strong BTC rally could spark renewed optimism across the board. Traders are now keeping a close eye on whether BTC can maintain its position above the key psychological levels shown on the chart, as this could trigger another wave of buying momentum.
Investors are increasingly looking at BTCUSDT as a safe bet in an otherwise volatile market. Bitcoin’s fundamentals remain strong, with growing adoption, continued development, and macroeconomic conditions that could favor a hedge like BTC. Combined with the current technical setup, the outlook is promising for a big move to the upside. As we approach the next few weeks, the market sentiment suggests that any dips towards the key support level might be seen as attractive buying opportunities.
✅ Show your support by hitting the like button and
✅ Leaving a comment below! (What is You opinion about this Coin)
Your feedback and engagement keep me inspired to share more insightful market analysis with you!

BTC Price Prediction and Elliott Wave AnalysisHello friends,
>> Thank you for joining me in my analysis. I think we have finished the 1st wave in B wave as Pink W, in this micro correction. In my opinion, we will watch 2nd & 3rd waves XY as in pink color, or Yellow B wave ended successfully, just I need to these confirmations:
* Day TF: Breaking 118451 for the next days and keep on above it, lead to ending B wave successfully.
* 4Hr TF: Breaking 118451 for the next hours and keep on above it, lead to ending W wave successfully ( maybe also B ?)
keep like and support me to continue, See you soon!
Thanks, Bros

BTC short and long setupBoth may happen. i want Bitcoin grab liquidity first and then fall tell next liquidity.
Btc UpdateBTC is moving within a falling wedge and is making its fourth breakout attempt.
A successful breakout and retest of the wedge would confirm a bullish trend, while rejection could signal further movement within the wedge.

Bitcoin is getting Ready for 143K$ nowMajor red resistance trendline is now broken also last week the retest is completed now price is range for a while for new week to start and fresh volume and buys that make path easier to reach above 140K$.
Get ready and take a look at important zones at chart and possible scenarios which are all mentioned.
DISCLAIMER: ((trade based on your own decision))
<<press like👍 if you enjoy💚

BITCOIN next target 130000-134000 pattern repeatedHi guys, this is my analysis for BTCUSDT in the next few days.
Feel free to check it and write your opinion in the comments.
BITCOIN had been consolidating for two weeks before it reached the ATH 123500 and I think bitcoin has proven to repeat itself. This happened before, and it will happen again.
After reaching the ATH, Bitcoin has been consolidating for the last two weeks.
Therefore, I think that BITCOIN will reach
130000-134000
In the next few days.
Please respect each other's ideas.
This is not financial advice, it's just my humble analysis.
BTCUSDT.P LONGThe price is squeezed and its Sunday we might get a big move Positive Lets hope for the best and plan our trading.
I have marked 2 entries I think the more we wait the more we get.
So entry 2 in my opinion will be more beneficial to trail this trade. Anyhow if we see any bullish momentum on these level we are IN guys.
WHY? why i planned this trade as we can see the we are on sunday and price squeezed and we are already in bull run and we can see the price break the curve resistance so i hope the price will retest the level and if we see bullish candle patterns than only we will execute it.
If you like my previous ideas and analysis please don't forget to follow me. We all need encouragement. The more followers the more encouragement.

The move is up to the buyersHi traders and investors!
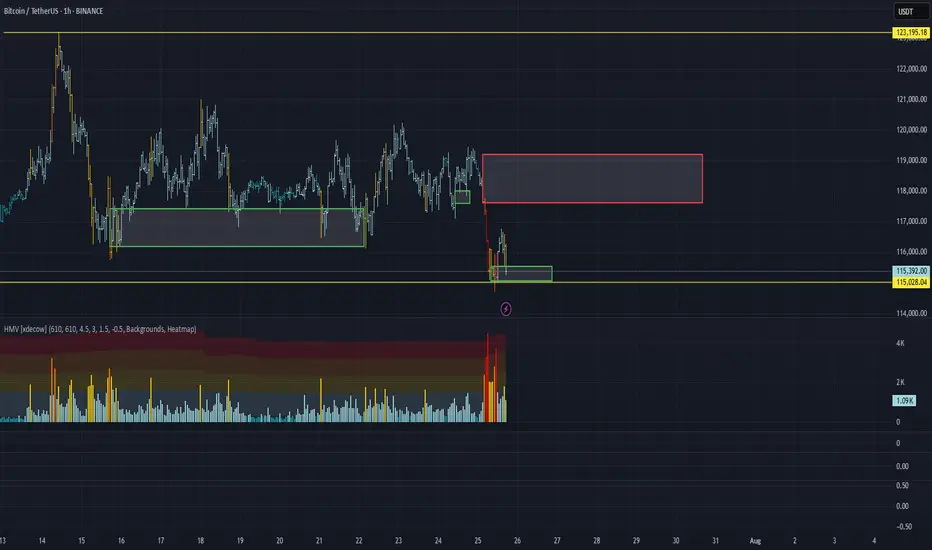
The price has already played out the upper boundary of the scenario, rising above 120,500. Then it also reached the lower boundary by dropping below 115,222.
Now we are at an interest moment: will the price continue to move upward or not?
This situation is clearly visible on the 8-hour timeframe.
On the 8H chart, we see a sideways range, similar to the 1D timeframe. The lower boundary is 115,736 and the upper boundary is 123,218. The active initiative is currently with the buyers, and their target is 120,998 и 123,218.
There is a notable bar attacking the lower boundary (115,736) with very high volume. The high of that bar is 118,451. We’re watching to see whether buyers absorb this bar — that will determine how the next move plays out.
There are three key levels where buyers may step in: 116,782, 116,128, and 115,736. If the price drops to any of these, we can look for a long setup.
Above, we also have three resistance levels from the sellers: 118,451, 119,676, and 120,247. We’ll be watching how sellers react if the price tests these zones.
This analysis is based on the Initiative Analysis concept (IA).
Wishing you profitable trades!

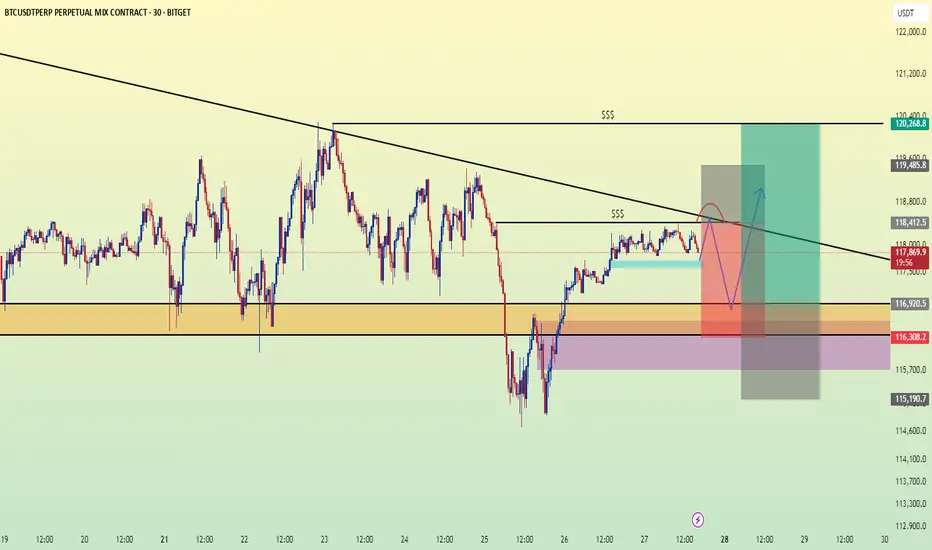
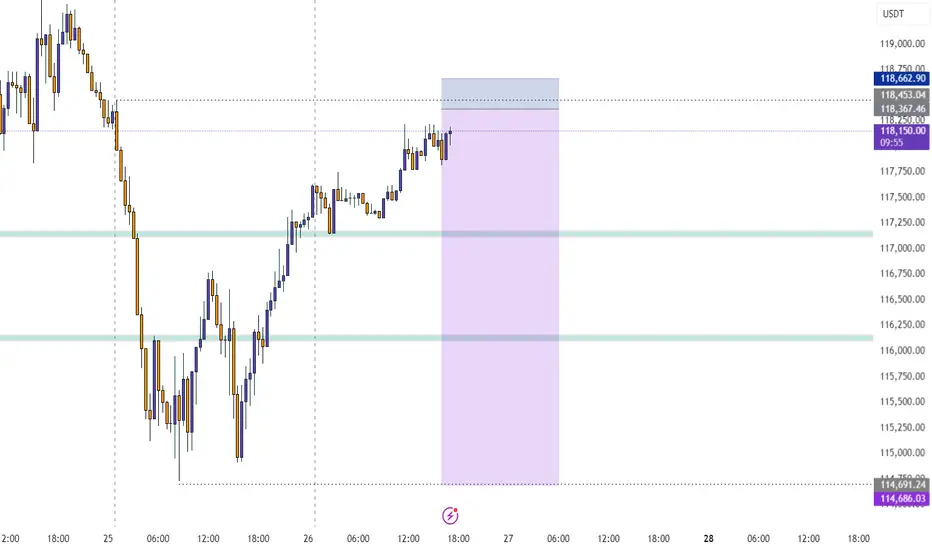
#BTC Update #10 – July 27, 2025#BTC Update #10 – July 27, 2025
Bitcoin continues to move between $116,400 and $118,900, and staying within this range is actually a positive sign, even in bearish scenarios. A decisive close below $114,000, however, could open the door for a deeper and more prolonged correction.
Although BTC hasn’t broken to new highs yet, its ability to hold here means the trend isn’t broken. A strong breakout above $118,900 could lead to a rally toward $123,300 and possibly even $128,000.
🔹 On the 4H chart, BTC seems to have completed its minor correction.
🔹 On the daily chart, the correction remains incomplete – despite dipping to $114,700, the key $112,900 zone hasn’t been tested.
In lower timeframes, BTC remains squeezed within a symmetrical triangle. While it occasionally pokes out, it quickly returns inside — showing indecision.
📌 Direction is unclear at the moment. There’s no strong signal for Long or Short. Waiting for confirmation with volume and a clear breakout is the safer play.

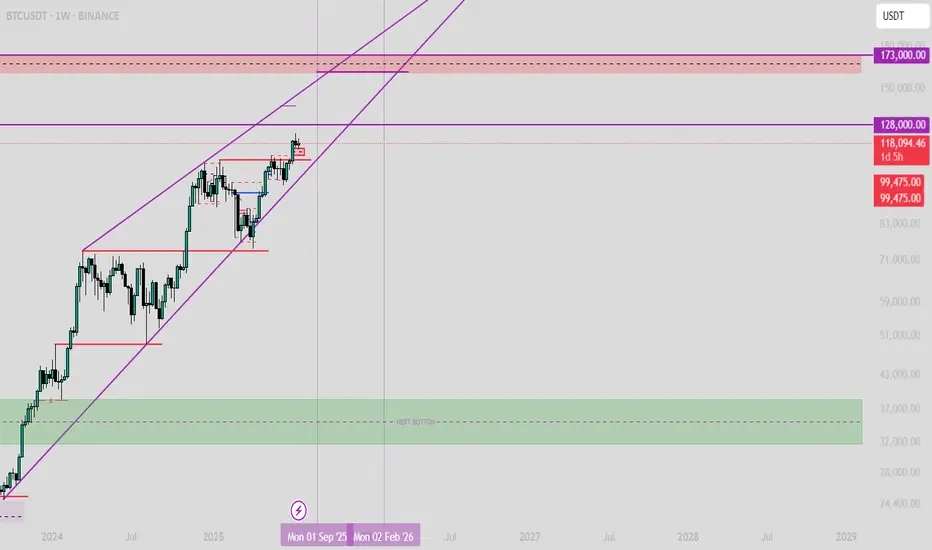
BTC - Prediction for the Final TOP AND the next BOTTOMAfter several analyses that I published on Trading View, I want to share my opinion on the Final Top and the next Bottom for Bitcoin!
The final Top will be between 160,000 and 174,000.
The next Bottom will be between 31,000 and 40,000. (Simply under 40,000).
This is not guaranteed, and it's just an analysis; it can happen or not, so be careful.
$BTC Important levels to watch1- Important levels to watch for TOP are:
128,000
139,000
161,000
173,000
2- The most important levels are 161K & 173K
3- But apart from these levels, be ready for any level to be the TOP.
(and again, Bull market is not over, watch my previous analysis BTC/XAG on the last post)

SellRejection Level
Daily Volume
Market Structure Shift
London US Session
Trend Line Break
Untapped Order Point
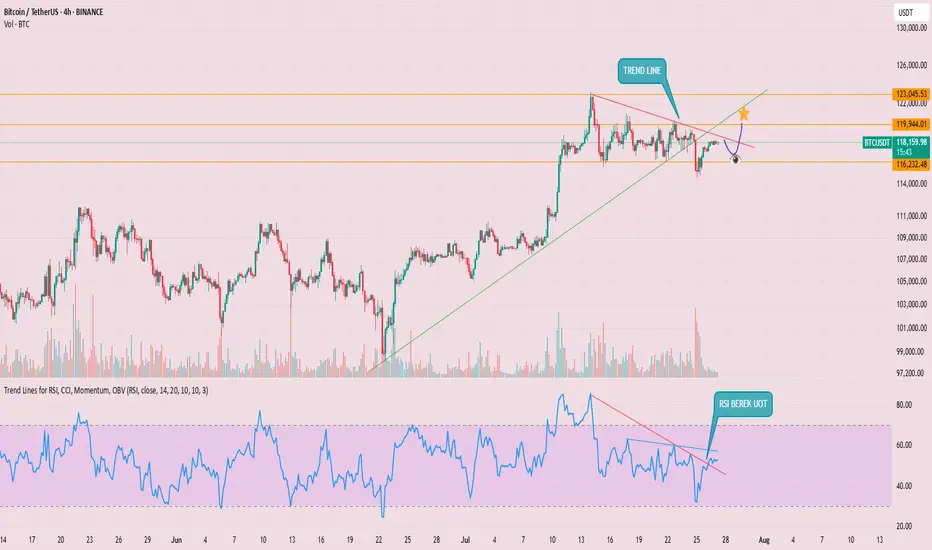
Fake Breakout at $116,522 Could Signal BTC Bull Continuation📈 Fake Breakout at $116,522 Could Signal BTC Bull Continuation — Watch Altcoin Triggers
After a fake breakdown below $116,522, Bitcoin is showing signs of resuming its uptrend.
A key bullish signal was yesterday's daily candle closing above this level — maintaining structure and giving bulls hope.
🔍 Current Strategy:
For BTC, I suggest watching $119,151 as a long trigger, only if BTC Dominance is rising.
If BTC.D isn’t rising, then it’s better to focus on altcoin long setups.
I’m still not opening any short positions — structure remains bullish, and risks of fake breakdowns remain high.
---
💬 Altseason loading? Drop your favorite alt setups in the comments!

Wyckoff ReaccumulationCurrent range looks like another reaccumulation range. Spring has just occurred and looking for a move back and then above the top of the range.
Bearish if we breakout then retrace forming an upthrust after distribution (UTAD).

BTCUSDT ready to march towards 140k zoneHere is once again a view of what I had shared when BTCUSDT was trading around 95k in may 2025.
The price action has been similar to our expectation. A push towards 106k-110k and then drop around 95k-98k before boucing towards 137k.
So the next stop for the current upward move is 137k. The push from 98k has brought us into 120k zone and currently we were holding in that range from 114k-120k for a while.
However, this is going to change now. I believe the last drop towards 114k was a false breakdown from 4h support 4HS1 since the price quickly grabbed this region again by moving towards 117k.
I believe the path to 137k-144k is clear now and we see that in coming weeks. After that we shall likely see a correction towards 120k area before move to the target around 150k.
Lets see how the price moves. We will keep monitoring it time to time and I will provide updates. But till now it has been moving according to the plan.
#BTC #BTCUSD #BTCUSDT #BITCOIN #CRYPTO CRYPTOCAP:BTC $crypto

BTCUSDT-Retested and Ready for the Next Leg Up?The 50 EMA has been acting like a strong dynamic support throughout the uptrend, keeping the structure intact. Every time price broke out of a consolidation or resistance zone, it came back, retested it, and then continued moving higher.
Most recently, BTC broke above a key resistance, pulled back to retest it, and now it looks like the breakout has held. This is a classic bullish continuation setup, and historically, it’s led to strong follow-through moves.
As long as BTC stays above the 50 EMA and holds support, the bullish structure remains intact.

BTCUSDT 6H#BTC is currently working on filling the CME Gap between $115,635 – $114,060 in the Futures chart, as previously mentioned. On the 6H spot chart, a falling wedge has formed, and there's a high probability of a retest of the wedge’s support line.
This support line lies within the support zone at $114,723 – $114,159, and the 6H SMA100 adds another layer of confluence. A dip into this zone is normal and not a cause for concern.
📌 In case of a bounce and breakout above the wedge resistance, the next upside targets are:
🎯 $119,505
🎯 $120,805
🎯 $122,461
However, if the support zone breaks, the potential downside targets will be:
🔻 $112,021
🔻 $108,977
📉 According to the liquidity map, there’s a cluster of liquidity around $114,000, and a brief wick below it is likely. Be cautious with your entries and exits.
⚠️ As always, use a tight stop-loss and apply proper risk management.

BTC/USDT Analysis. Range Breakout
Hello everyone! This is the daily analysis from a trader-analyst at CryptoRobotics.
Yesterday, Bitcoin bounced off a local sell zone on the 15-minute timeframe (previously mentioned), but a full-fledged bullish move did not follow. Instead, the less likely scenario played out — we broke the range to the downside and tested an important buy zone around ~$115,000 (zone of initiating volumes). Almost immediately, anomalies appeared in the cluster search near this level, and we quickly saw an initial rebound.
At the moment, a retest of ~$115,300 is likely. If buyers show proper reaction there, we could resume an upward move toward the $117,600–$119,200 area (accumulated volumes). To continue the long scenario toward the ATH, we need to consolidate within this area or break through it without a strong seller response — which is less likely.
A short scenario becomes possible if there is no buyer reaction around ~$115,300. In that case, a decline toward the next major support zone is expected.
Buy Zone:
$110,000–$107,000 (accumulated volumes)
Sell Zone:
$117,600–$119,200 (accumulated volumes)
This publication is not financial advice.