BTCUSDT BEARISH LONG CHART ANALYSIS📉 BTCUSDT – Bearish Setup in Play (1H)
Bitcoin faces rejection near 119500 resistance and is currently trading around 117000. If price breaks below 115000, bearish momentum may extend toward the 112000 target zone.
🔸 Resistance: 119500
🔸 Support Zone: 115000
🔸 Bearish Target: 112000
Structure remains weak unless buyers reclaim 119500. Watch price action closely.
---
📌 This analysis is for educational purposes only. Trade safe and manage risk properly.
BTCDOWNUSDT trade ideas

BTC/USDtBTC is currently showing signs of short-term weakness. A break of $117k might give us a swift drop to $111k before we ramp back up. It will be a quick buy opportunity in my opinion. From there alts will move! I hope you are ready for one heck of a ride up on altcoins!

BTCUSD NEW LOOKBtc sell from117,500
tp 116,500
tp2 115,500
tp3 115,500
Stopelose 118,500
Trade at your own risk
BTC-----Sell around 118300, target 116000 areaTechnical analysis of BTC contract on July 21:
Today, the large-cycle daily level closed with a small negative line yesterday, the K-line pattern continued to fall, the price was below the moving average, and the fast and slow lines of the attached indicator showed signs of a dead cross, and the overall trend has been in a sluggish state recently. The trend in the big trend also showed obvious signs of falling, so we have to pay attention to the strength and continuation of the retracement next; the short-cycle hourly chart price fell under pressure in the early morning, and the current K-line pattern continued to fall, the price was below the moving average, and the attached indicator was dead cross, so the price fell to the previous low of 115700 area. So you can sell after the pullback during the day, and pay attention to the breakout and strength and weakness trend of the European session.
Today's BTC short-term contract trading strategy:
Sell in the 118300 area, stop loss in the 118600 area, and target the 116000 area;

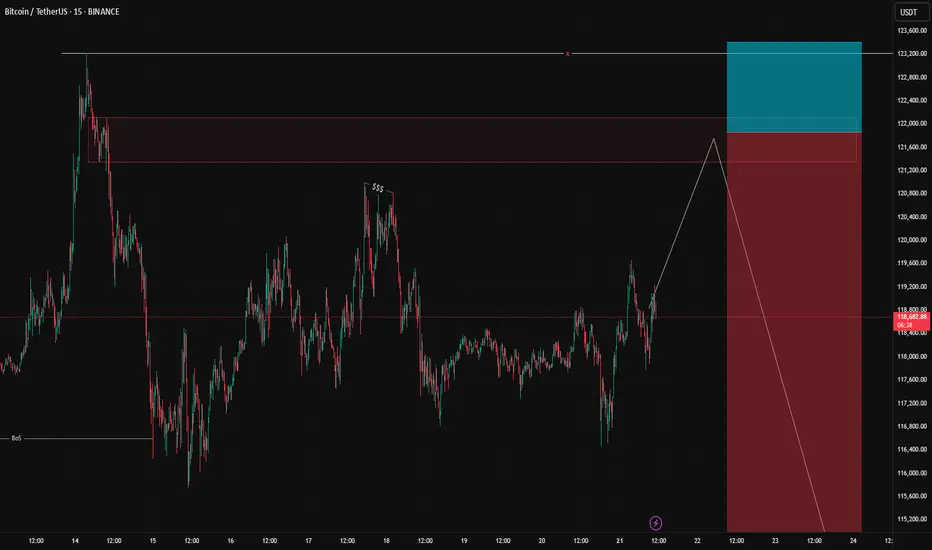
BTC-USDT ShortHI
This is my idea aboute BTC zone , i'm lookine for Sell position in this zone , i think the market needs correction for next run ;)
this is my personal idea , and not commrtial advice .
MKHZ
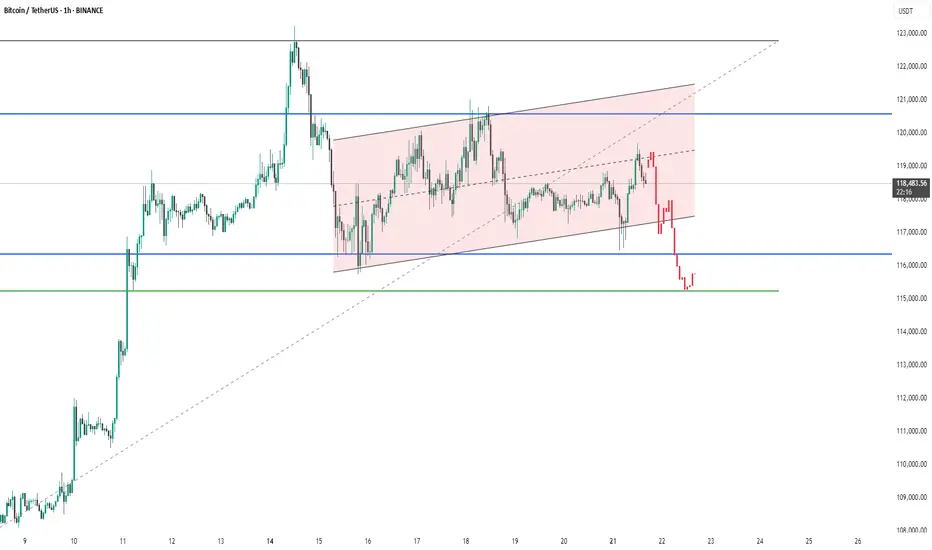
BTC #Bitcoin (BTC/USDT)chart shows on a 1-hour timeframeThe chart shows Bitcoin (BTC/USDT) on a 1-hour timeframe experiencing a breakdown from an ascending channel (highlighted in pink). After reaching resistance near $120,800, price sharply declined, breaking below both the channel support and the key horizontal support around $117,000 (blue line). It is now testing the next support zone around $115,000 (green line). This suggests strong bearish momentum, and if $115K fails to hold, further downside could be expected.
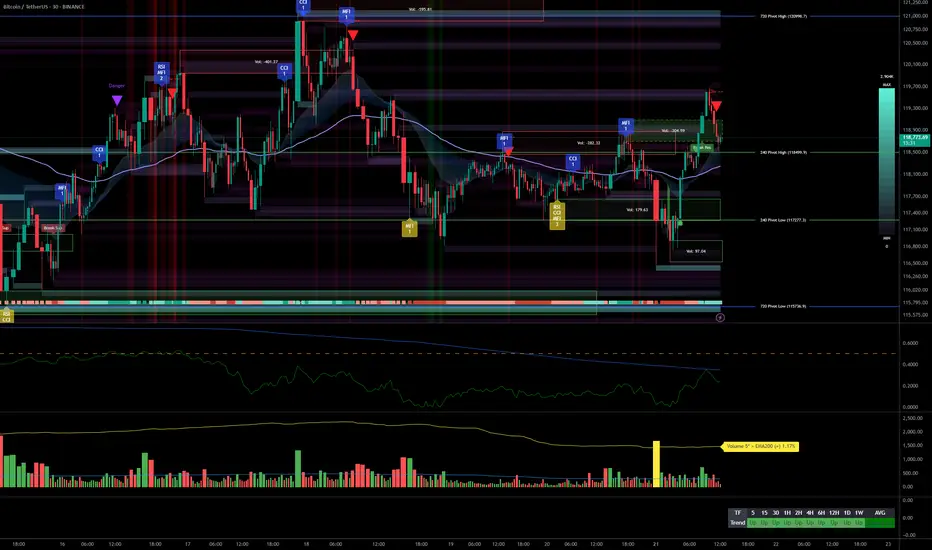
Bullish Multi-Timeframe Alignment, Macro Risks & Key Levels__________________________________________________________________________________
Technical Overview – Summary Points
__________________________________________________________________________________
Momentum: Strong bullish trend across all timeframes.
Major Supports: 115796/117277 (720/240 Pivot Low).
Key Resistances: 119000–123200 (240/D Pivot High), watch for potential extension or profit-taking.
Volume: Healthy participation, no marked anomalies.
Risk On / Risk Off Indicator: Strong sector momentum except 15min (neutral), risk appetite confirmed.
Multi-TF Behavior Synthesis: No "behavioral sell" warning, ISPD DIV neutral, no climax.
__________________________________________________________________________________
Strategic Summary
__________________________________________________________________________________
Global Bias: Clearly bullish, all timeframes aligned, no notable technical divergences.
Opportunities: Buy on pullback (HTF support) or on breakout/consolidation above 123200 with increasing bullish volume.
Risk Zones: Drop below 115796 invalidates scenario; watch for “sell” behavioral signals (ISPD red/extreme volumes) or persistent sector divergence.
Macro Catalysts: Next Fed meeting (July 21st), ongoing geopolitical tensions.
Action Plan: Closely monitor supports/resistances, strict stops below 115796, dynamic adjustment to upcoming macro volatility.
__________________________________________________________________________________
Multi-Timeframe Analysis
__________________________________________________________________________________
1D: Bullish breakout, leading tech/growth sector, stable volume.
12H: Bullish signal, price held above all key HTF pivots.
6H: Consolidation below key resistance 123218, no distribution, strength intact.
4H: Sideways just below resistance, controlled pause, possible push upwards.
2H: Stalling under resistance yet bullish momentum still present.
1H: Supports defended, rising volume on rebounds, no excess.
30min: Intraday momentum positive; no signs of reversal, strong indicator consensus.
15min: Testing pivots, slight momentum decline, neutral on Risk On / Risk Off Indicator.
__________________________________________________________________________________
Technical confluence: All timeframes aligned upward, strong sector momentum, controlled volumes, no behavioral excess. Watch for resolution near the 119000–123200 resistance zone (potential supply), and monitor for alert signals on behavioral/volume side. Macro: anticipate volatility around July 21 (Fed).
__________________________________________________________________________________
Macro & Decision Synthesis
__________________________________________________________________________________
News / Macro: Upcoming Fed meeting = caution period, expected volatility spike. Geopolitics: Middle East/Europe tensions, no Asian shock.
On-chain: BTC in price discovery, initial STH profit-taking, everyone in latent profit (interim top risk if overheated, reward up to $130k possible).
Actionable checklist:
Optimal entry: Pullback on 115796–117277 or strong breakout above 123200 with confirmed volume
Stop-loss: Below 115796 (major pivot); intraday swings below 117277
Imperative risk management, avoid leveraged trades ahead of macro event
__________________________________________________________________________________
Final Conclusion
__________________________________________________________________________________
Bitcoin is structurally bullish, supported by perfect multi-timeframe alignment, strong sector leadership (Risk On / Risk Off Indicator), and positive on-chain signals. However, proximity to historical resistances and looming volatility call for strict, active risk management. Targets: $123k/$130k; stops below 115796.
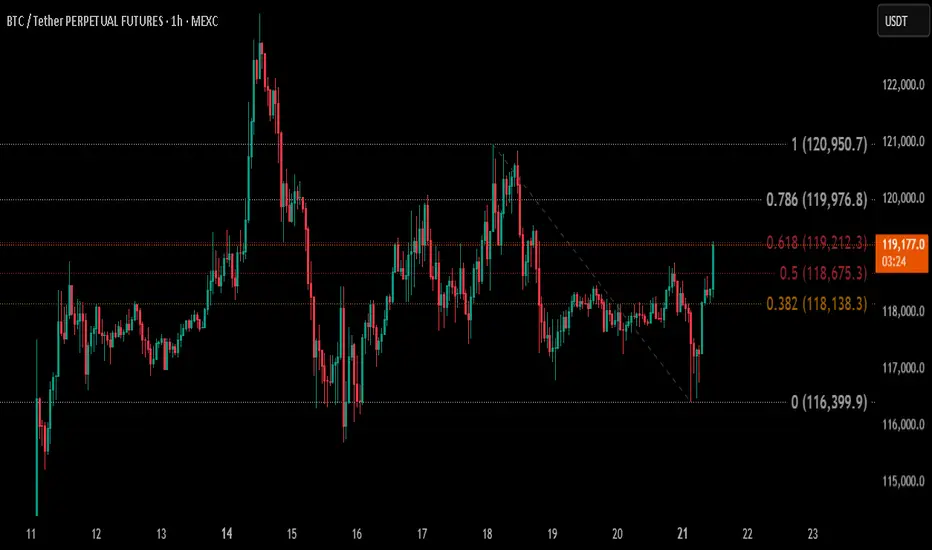
BTC/USDT – Fibonacci Levels in PlayMEXC:BTCUSDT.P
🔹 Price pushing through key resistance zones
BTC just tapped the 0.618 Fibonacci level (119,212) after breaking above 0.5 — signaling strength in short-term momentum. If bulls can hold above this level, the next logical targets are:
➡️ TP1: 119,976 (0.786)
➡️ TP2: 120,950 (Full retracement)
🔸 Key Support: 118,675
🔸 Invalidation below: 118,500
Holding above the golden zone (0.618) increases the probability for a full move toward 121K. Watching price reaction closely here — breakout or rejection will decide the next leg.
🔄 Keep supporting by sharing and dropping your thoughts!
🚀 And don’t forget to hit that Boost button – it helps and motivates me to keep bringing top-level analysis for you all 🙌
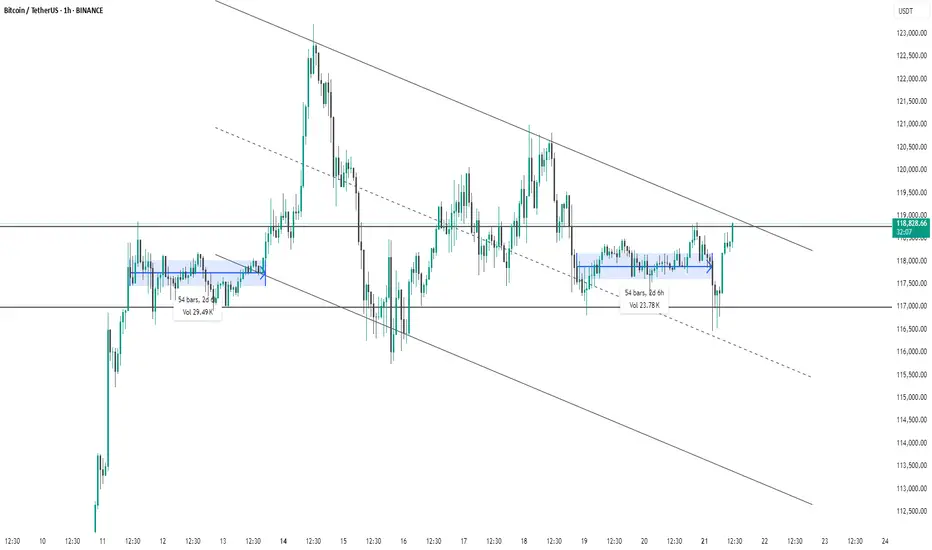
BTC #1-hour chart of Bitcoin/USDTThis 1-hour chart of Bitcoin/USDT (Binance) shows a descending channel pattern with clearly defined upper and lower trendlines. Price has recently broken out of a consolidation zone (highlighted in blue) and is now testing the upper boundary of the descending channel near $119,000. The breakout from the recent range (lasting 54 bars / 2d 6h with 23.78K volume) suggests bullish momentum. However, for confirmation of trend reversal, a strong breakout above the channel is needed. Until then, the broader downtrend structure remains intact.
thanking you
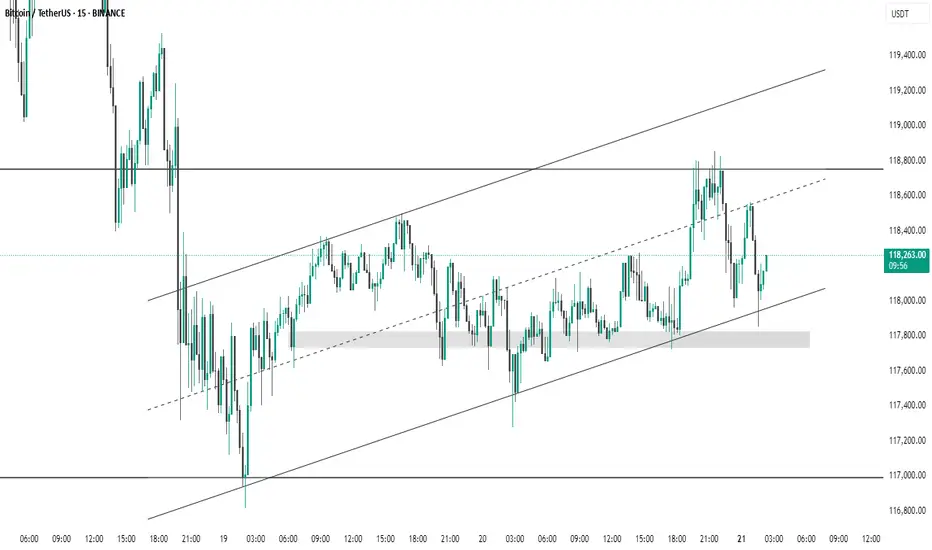
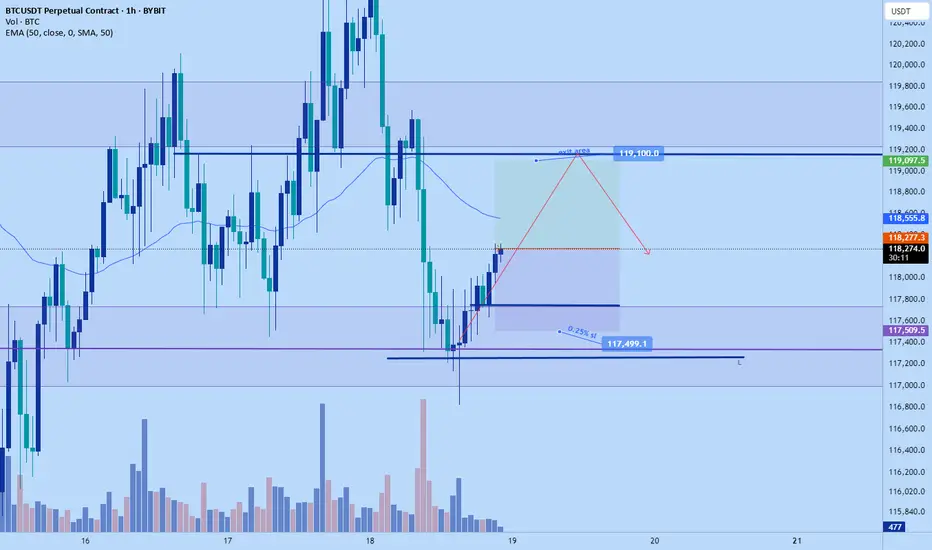
BTC #15-minute BTC/USDT chart This 15-minute BTC/USDT chart from Binance shows Bitcoin trading within an ascending channel. Price recently bounced off the lower trendline and a highlighted demand zone around 117,800 USDT, suggesting strong support. The upper channel and resistance near 118,800 USDT may act as potential targets. Short-term momentum appears bullish as long as price holds above the support trendline.
BTCUSDTBTCUSDT Updated in H1 :
The gold signal is marked on the chart based on the latest price changes and the supply and demand in the market. These points include the entry point, stop loss, and take profit

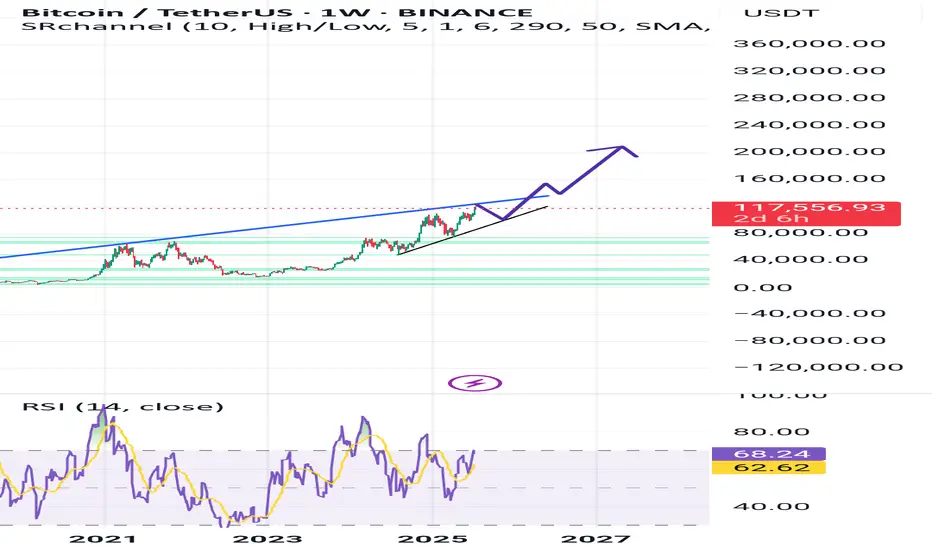
Bitcoin: Promising Patterns and Potential BreakoutBitcoin's recent price action has been nothing short of captivating for traders and analysts alike. On the daily chart, we've observed the formation of an Inverse Head & Shoulders and a Cup & Handle pattern, both of which have now transitioned into a Bull Flag. These bullish signals suggest a strong potential for upward movement.
Zooming into the 4-hour and 1-hour charts, we can see prominent Ascending Triangles taking shape. These patterns are often harbingers of significant breakouts, and it appears that Bitcoin is winding up for a substantial move.
Moreover, when utilizing a Trend-based Fibonacci Extension on the daily timeframe, the golden pocket points to a target of $126k, with the next pocket at $185k. This aligns with historical data and technical indicators, suggesting that Bitcoin might be poised to rewrite history once again.
Stay tuned as we monitor these developments and anticipate what could be a historic breakout for Bitcoin!

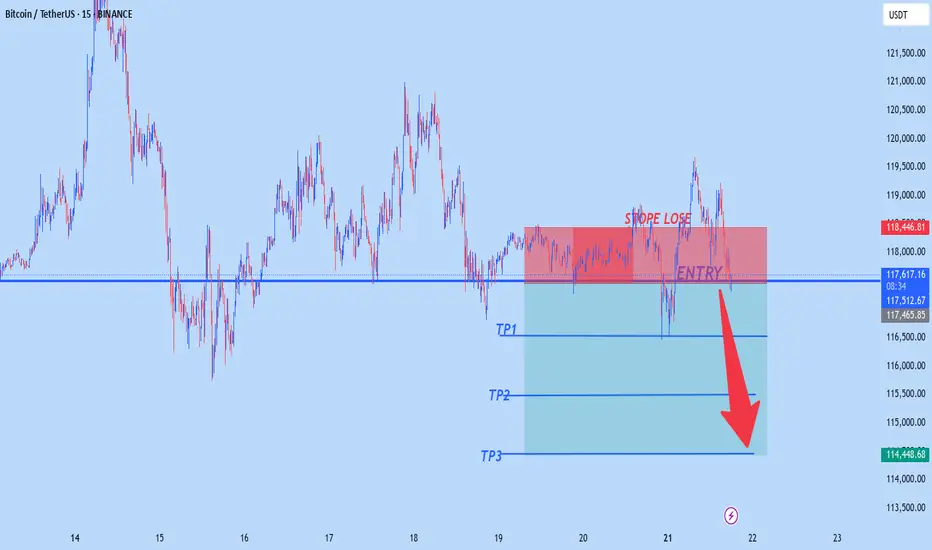
BTCUSD SHORT POSITION = SELLWe can see that BTCUSD consolidated a and ended up given us a possible sell.
To my point of view, we can take a sell position at an Entry = 117878.44 with a proper calculated risk of a SL = 118285.00.
With this short position we can expect to take our profits at the following zones:
TP1: 117509.65
TP2: 117386.65
TP3: 117267.62
TP4: 117066.41
The takes profits are a calculated Risk Reward Ratio of 1.00 to 2.00
It is advisable to use a small lot size or according to your account

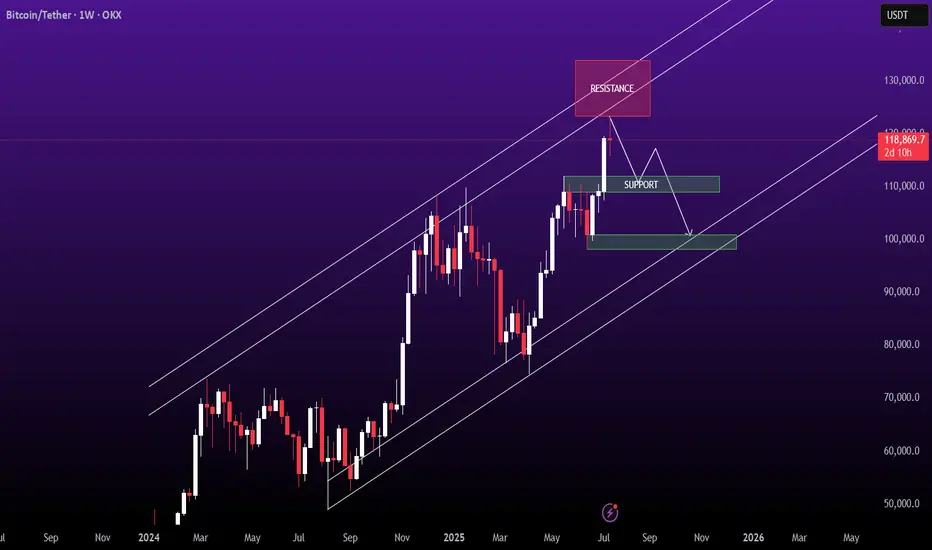
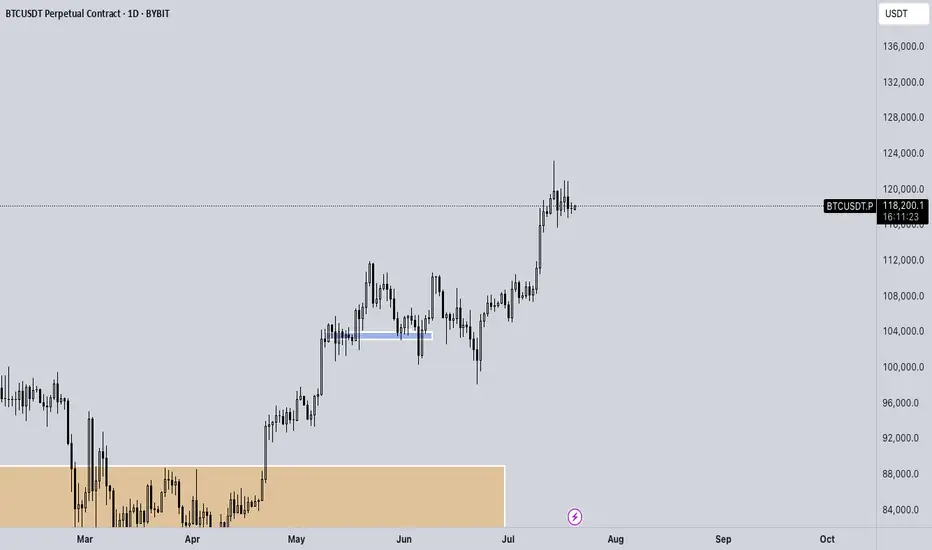
BTC - Ranges overview (update) BTC has been moving nicely lately so let's see where we go from here.
As previously mentioned, we should expect an aggressive move upwards towards 110K and eventually new ATH. As expected we got the move and are now trading around 120K.
IF we fail to hold the sellside at 115K expect us to trade back towards 110K.
IF we hold our current levels expect further upside towards new ATH.
No NEED TO FRONTRUN THE MARKET. BE PATIENT AND TRADE WITH IT.
Stay safe and never risk more than 1-5% of your capital per trade. The following analysis is merely a price action based analysis and does not constitute financial advice in any form.
BTC #Bitcoin (BTC/USDT) on the 1-hour timeframeThis chart shows Bitcoin (BTC/USDT) on the 1-hour timeframe, highlighting two periods of sideways consolidation (marked in blue).
Both zones lasted 64 bars (2d 16h), indicating similar market indecision or accumulation/distribution phases.
The first consolidation (left) was followed by a strong bullish breakout, while the second (right) is currently unresolved.
Price is trading within a tight range between ~117,600 and ~118,400 USDT, suggesting potential for an imminent breakout or breakdown.
Volume during the current consolidation is lower than the previous one, hinting at reduced momentum.
This setup may signal a key move once the price exits this range.
thanking you

Buy Signal at 117k, Eyeing 118.5k BreakoutDescription:
Bitcoin is consolidating just above the 200 EMA on the 1H timeframe, forming a slight ascending triangle. A buy around 117,000 with TP set at 118,421. With RSI near neutral and QQE MOD potentially flipping bullish, we are watching for a breakout above 118,500 for continuation. SL sits below the recent swing low at 116,485.
Trade Setup
Long Entry: 117,000 (as signaled)
Take Profit: 118,421 or higher (watch 118,800 zone)
Stop Loss: 116,485
Alternate Trigger: Break and close above 118,500 with increased volume = breakout entry
Invalidation:
A break below 116,400 (below SL zone and 200 EMA) could invalidate the bullish thesis and open downside toward 114,000.
Confirmation to Watch
Breakout candle above the 50 EMA with volume spike
QQE MOD crossover with histogram flipping blue
RSI moving above 50 confirming strength

Bitcoin at 120,000: Decisive Breakout or Renewed Consolidation?__________________________________________________________________________________
Technical Overview – Summary Points
__________________________________________________________________________________
Momentum: Strongly bullish on H1 and above; healthy consolidation below ATH.
Supports/Resistances: 120,000 USDT (pivot resistance), 116,400–117,000 (major support), 104,000–110,000 (long-term support).
Volumes: Normal, no anomaly nor climax detected.
Risk On / Risk Off Indicator: Strong buy signal on all timeframes except very short term. Sectoral health confirmed.
Multi-timeframe: Short-term bearish divergence on 15/30min, but robust technical structure above H1-D1.
__________________________________________________________________________________
Strategic Summary
__________________________________________________________________________________
Global bias: Confirmed bullish across all timeframes; no major break detected.
Opportunities: Strategic buys between 116,400–117,000 (pullback); confirmed breakout above 120,000 (target 130,000).
Risk zones: Below 116,000 (potential correction to 112,000–104,000), false breakout at the top.
Macro catalysts: Monitor Fed (next FOMC July 29-30), volatility on risk assets, geopolitical tensions.
Action plan: Prioritize stop management, stay reactive ahead of macro events. Main scenario: buy confirmed pullback or validated breakout.
__________________________________________________________________________________
Multi-Timeframe Analysis
__________________________________________________________________________________
1D / 12H: Bullish structure intact but facing historical resistance (120k), strong supports in place (104–107k).
6H / 4H / 2H: Consolidation below resistance, no signs of exhaustion, tactical supports at 116,000–117,000.
1H / 30min / 15min: Weakness on shorter timeframes (sellers at top), confirmation of range polarization. No emotional excesses (ISPD DIV neutral), standard volumes.
Risk On / Risk Off Indicator: Strong buy except for very short-term fatigue.
Summary:
Multi-horizon bullish bias, technical and sectoral confluence for upside extension if clear breakout >120,000. Key support to hold at 116,400–117,000. Buy dips, ride breakout up to 130,000. Focus on risk management, flexibility advised as macro (Fed) nears.
__________________________________________________________________________________
Key macro events to watch
__________________________________________________________________________________
2025-07-18: Fed rate/volatility debate (Equity, Bonds, BTC).
2025-07-29: FOMC (potential pivot for risk assets).
__________________________________________________________________________________
Strategic decision & final summary
__________________________________________________________________________________
Main bias: Bullish, to be validated at key levels, favor buying dips/breakouts.
Risk management: Stop below 116,000, scale out progressively after 125k, reinforced protection ahead of FOMC.
Opportunities: Pullback 116,400–117,000 (RR >3); H4/D breakout >120,000 targeting 130,000 (RR >2).
Monitoring: Macro (Fed, geopolitics), dynamic management according to market response to news.
Conclusion:
A validated move above 120,000 projects target to 130,000 (next statistical/on-chain extension). Deep dips can be bought above 104,000. Do not loosen risk management as Fed date approaches.

Need to retest $91k before next big moveI think now Bitcoin can take healthy correction before to takeoff 🛫 for major upside move.
And if BTC break $124k than we can see $134.5k before take correction..
Let's see what will happen next..
The Critical Blue Line – Will Bitcoin Soar or Sink
🔹 Bitcoin Technical Analysis – Key Blue Line, Bear Trap Possibility & Long-Term Scenario
On the Bitcoin chart, the blue horizontal level has acted multiple times as both support and resistance. The price has broken it several times but failed to sustain above, indicating high-volume decision-making zones by institutions and large players.
📉 Why this pattern keeps repeating:
Strong supply and demand concentration at this level.
Inability to break and hold shows market indecision.
Repeated fakeouts are likely used to shake out weak hands.
🔍 Important hidden scenario: Bear Trap Potential
If the price dips below the blue line but quickly reclaims it, it may form a bear trap, tricking short sellers into entering prematurely. This move could ignite strong bullish momentum from trapped sellers and renewed buyers.
🔮 If price holds above the blue line:
Signals market strength and potential bullish structure shift.
Targets:
109,800
117,200
120,000+ (Long-term)
📛 If support fails again:
Retracement toward the lower channel near 101,000 or lower is possible.
📊 Conclusion:
This zone is one of the most critical decision points in the current market. Traders should combine volume, candlestick behavior, and confirmation signals to avoid getting trapped by fake breaks


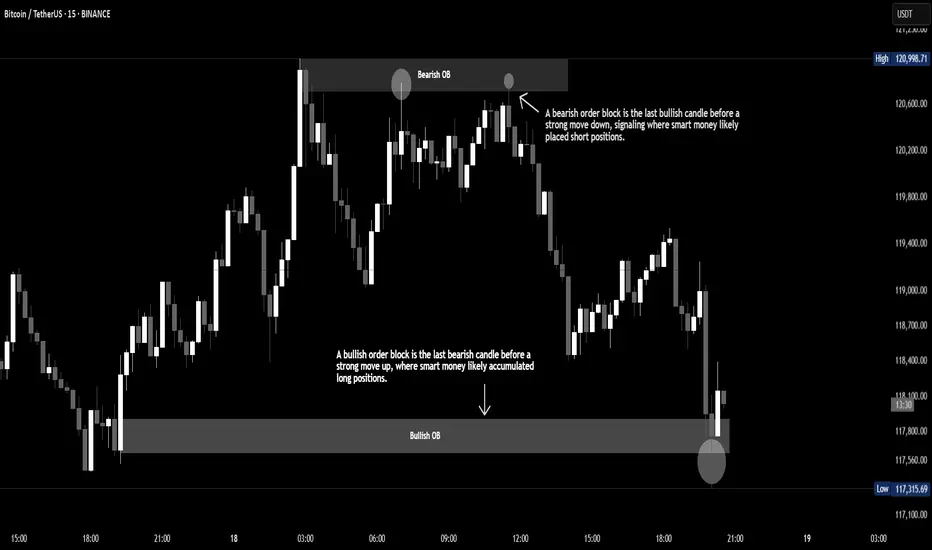
Order Block Explained Order blocks are zones where big players (like institutions) place large orders, often leading to strong moves in price. They act as key areas of interest—bullish order blocks signal potential upward moves, while bearish
Bears Getting Ready On #BTC#BTC is approaching a key resistance zone after a strong rally. Bearish signals are forming on the chart, suggesting a potential reversal. A short position could be favorable if the price fails to break above this level. Watch for confirmation before entering the trade