BTCDOWNUSDT trade ideas

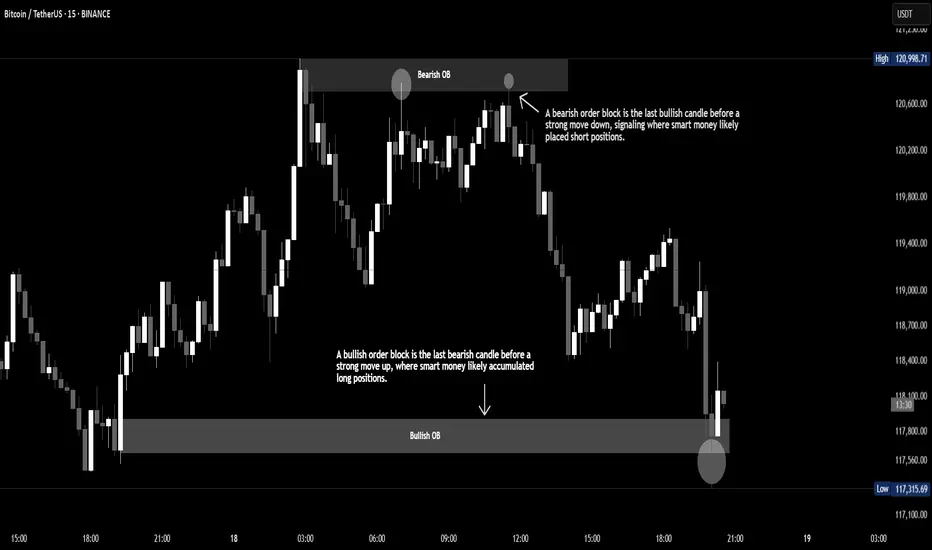
Order Block Explained Order blocks are zones where big players (like institutions) place large orders, often leading to strong moves in price. They act as key areas of interest—bullish order blocks signal potential upward moves, while bearish
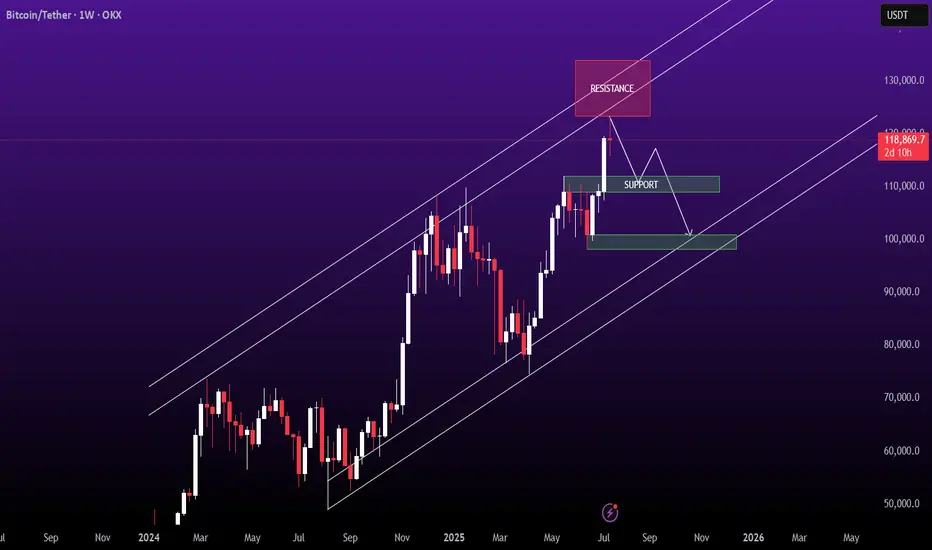
Bears Getting Ready On #BTC#BTC is approaching a key resistance zone after a strong rally. Bearish signals are forming on the chart, suggesting a potential reversal. A short position could be favorable if the price fails to break above this level. Watch for confirmation before entering the trade
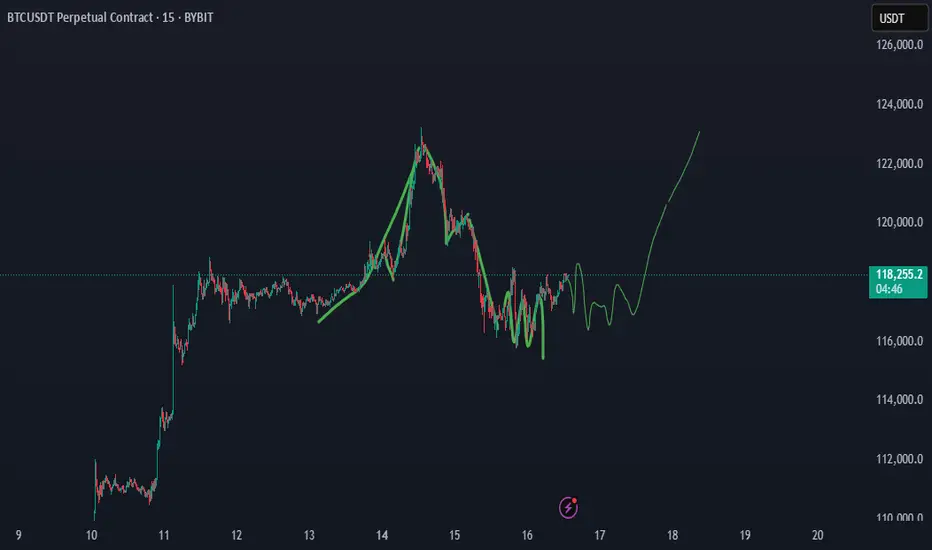
BTC-----Buy around 118000, target 120000 areaTechnical analysis of BTC contract on July 18:
Today, the large-cycle daily level closed with a small positive line yesterday, the K-line pattern continued to rise, the price was above the moving average, and the attached indicator was golden cross and running with shrinking volume. The large-scale upward trend is still very obvious. After the previous strong performance, there was a short-term shock correction trend. According to the current trend rules, it is a correction and a trend of market demand. The trend has not changed; the short-term hourly chart yesterday's European session price support rebound, the current K-line pattern continued to rise and the attached indicator was golden cross, so we still have to look at the continuation of the break in the day and the European session. The moving average support position is 120,000 area; the high point is near 121,000 area.
Today's BTC short-term contract trading strategy:
Buy in the 118,000 area, stop loss in the 117,000 area, target the 121,000 area, break the position and look at the 121,500 area;

Bitcoin : Stay heavy on positionsApril was the scale-in zone:
Back in April, the US stock market flashed a split-entry buy signal—a classic zone for gradual accumulation.
That same setup applied to Bitcoin. Buying the fear worked again.
We’ve moved out of the fear zone:
Both Bitcoin and equities have left the extreme fear territory behind. Sentiment has shifted.
Short-term overbought now:
Bitcoin is currently in a short-term overbought phase. Some consolidation or cooling off is natural here, but no major trend reversal signs yet.
Stay heavy on positions:
I’m maintaining an overweight position in Bitcoin as long as the US stock market stays intact. The Nasdaq is holding up, so Bitcoin likely stays in risk-on mode.
Warning:
If US equities take a hit, expect Bitcoin to follow.
Negative moves in the stock market will likely translate directly into crypto weakness.

Coinbase Premium indicates High Risk on BTCThe Coinbase Premium Indictor shows the CBP risk is high. The previous times the CBP premium has reached these levels, CRYPTOCAP:BTC generally started a range or downtrend.

Why Your indicators Fail to Work For You and WHY.Many commonly used indicators—RSI, MACD, and others—show win rates around **30–40%** when used as direct trade signals and may make a slight profit overall, but loose in a ranging market.
Oddly enough, if you reverse them—buy when it says sell, sell when it says buy—you can often push the win rate up to **65–70%**.
But here’s the catch:
👉 Even with a high win rate, these “inverse strategies” still **tend to lose money** over time. Why? The few times the market trends it will wipe out any profits you might have made.
---
🧠 What's Really Going On?
* Indicators trigger **crowd behavior**, not institutional intent.
* Institutions use crowd-driven signals to identify **liquidity clusters**
* Standard signals become **traps**, not trade ideas.
I call this Hidden or Dynamic liquidity
So when indicators say "Buy!", the smart money sees that as an opportunity to sell *into* the crowd’s enthusiasm—then reverse the move once retail traders are trapped.
Institutions can see when, say the 20 SMA is about to cross the 50 SMA. This gives them a heads up that and opportunity may be coming to use the liquidity it generates from the ensuing retail trades to enter their opposing trades.
---
⚠️ Takeaway:
Indicators may be more useful as **tools to locate liquidity**, not predict direction.
Use them to observe where *others* are getting in, then ask:
🔍 *If I were a large player needing liquidity, where would I execute my order?*
See Indicators triggering not as entry positions but as potential pivot points.
BTC - Last Resistance Before New HighsPrice is back at the same zone that rejected it months ago — but this time with momentum and a clean trendline behind it. Stoch RSI is stretched, signaling a possible short-term cooldown… or a breakout into uncharted territory.
Keep your eye on that 126K liquidity magnet 👀
#Bitcoin #BTCUSD #CryptoTrading #ChartAnalysis #TechnicalAnalysis #BreakoutTrading #TrendlineSupport #QuantTradingPro #TradingView

We are going downBitcoin clearly broken below this bear flag and retested lower line. Invalidation is close above 120k.
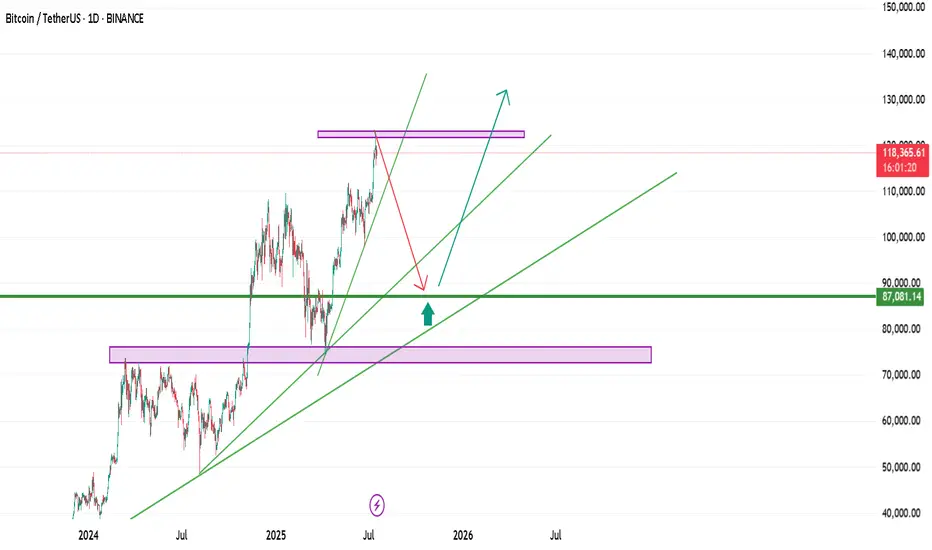
The new floor of BitcoinI calculated the new floor for low-risk entry for Bitcoin as 8700. If it falls from this ceiling, this floor can create pivot
BTC/USDT Heist Mode: Buy Low, Escape Rich🏴☠️"Bitcoin vs Tether" Crypto Market Robbery Blueprint 🔥 | Thief Trading Style (Swing/Day Plan)
🌍 Hey Money Makers, Chart Hackers, and Global Robbers! 💰🤑💸
Welcome to the new Heist Plan by your favorite thief in the game — this time targeting the "Bitcoin vs Tether" Crypto Market like a smooth criminal on the charts. 🎯📊
This is not your average technical analysis — it's a strategic robbery based on Thief Trading Style™, blending deep technical + fundamental analysis, market psychology, and raw trader instincts.
💼 THE SETUP — PREPARE FOR THE ROBBERY 🎯
We're looking at a bullish operation, setting up to break into the high-value vaults near a high-risk, high-reward resistance zone — beware, it's a high-voltage trap area where pro sellers and bearish robbers set their ambush. ⚡🔌
This plan includes a layered DCA-style entry, aiming for max profit with controlled risk. Chart alarms on, mindset ready. 🧠📈🔔
🟢 ENTRY: "The Robbery Begins"
📍 Zone-1 Buy: Near 116200.00 after MA pullback
📍 Zone-2 Buy: Near 112600.00 deeper pullback
🛠️ Entry Style: Limit Orders + DCA Layering
🎯 Wait for MA crossover confirmations and price reaction zones — don’t chase, trap the market.
🔻 STOP LOSS: "Plan the Escape Route"
⛔ SL for Pullback-1: 113000.00 (2H swing low)
⛔ SL for Pullback-2: 110000.00
📌 SL placement depends on your position sizing & risk management. Control the loss; live to rob another day. 🎭💼
🎯 TARGET ZONE: “Cash Out Point”
💸 First TP: 127000.00
🏁 Let the profit ride if momentum allows. Use a trailing SL once it moves in your favor to lock in gains.
👀 Scalpers Note:
Only play the long side. If your capital is heavy, take early moves. If you’re light, swing it with the gang. Stay on the bullish train and avoid shorting traps. Use tight trailing SL.
🔎 THE STORY BEHIND THE HEIST – WHY BULLISH?
"Bitcoin vs Tether" shows bullish momentum driven by:
💹 Technical bounce off major support
🌏 Macroeconomic & geopolitical sentiment
📰 Volume + sentiment shift (risk-on)
📈 Cross-market index confirmation
🧠 Smart traders are preparing, not reacting. Stay ahead of the herd.
👉 For deeper insight, refer to:
✅ Macro Reports
✅ COT Data
✅ Intermarket Correlations
✅ CHINA-specific index outlooks
⚠️ RISK WARNING – TRADING EVENTS & VOLATILITY
🗓️ News releases can flip sentiment fast — we advise:
❌ Avoid new positions during high-impact events
🔁 Use trailing SLs to protect profit
🔔 Always manage position sizing and alerts wisely
❤️ SUPPORT THE CREW | BOOST THE PLAN
Love this analysis? Smash that Boost Button to power the team.
Join the Thief Squad and trade like legends — Steal Smart, Trade Sharp. 💥💪💰
Every day in the market is a new heist opportunity — if you have a plan. Stay tuned for more wild robbery blueprints.
📌 This is not financial advice. Trade at your own risk. Adjust based on your personal strategy and capital. Market conditions evolve fast — stay updated, stay alert.

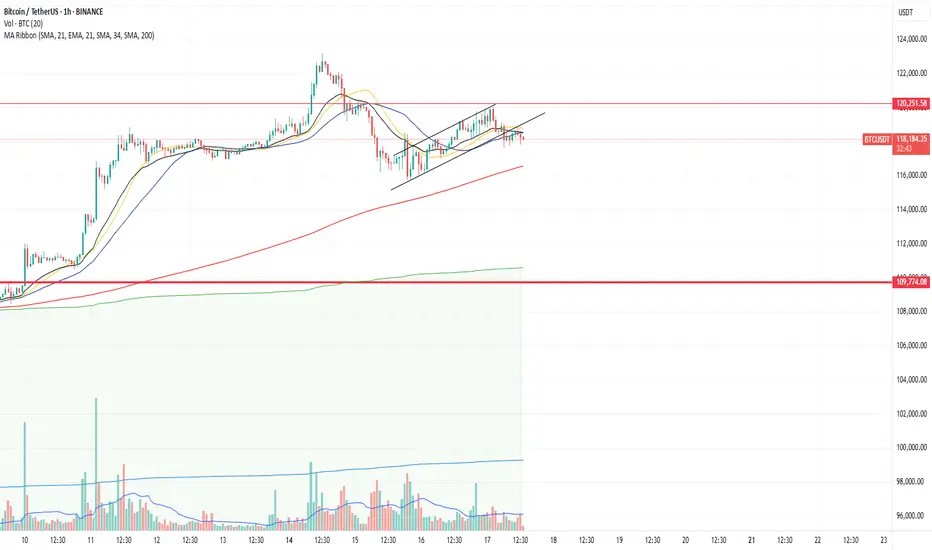
BTC Nears $120K – Pullback Risk or Breakout Launchpad?Bitcoin has rallied strongly after breaking its multi-week consolidation, now hovering just under the key psychological and historical resistance at $120K. The daily chart shows price floating above the 20EMA, with no signs of distribution—yet. However, the dense liquidity pocket between $110K–$114K remains a magnet in case of a technical pullback.
If bulls defend $118K and price cleanly breaks above $121K with strong volume, the next target lies in the $125K–$128K zone. Spot ETF inflows remain healthy, and any dovish pivot from the Fed could set off another crypto-wide bull wave.
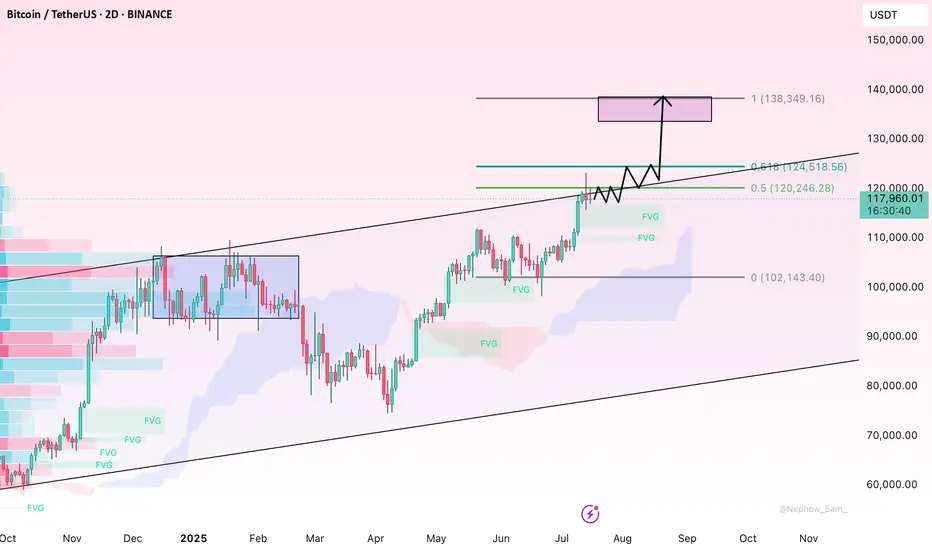
My Macro Take on BTCAfter checking BTC HTF charts, my take is that there is a resistance around $123K–$125K zone (psychological + measured move extensions). I drew a fib extension in november last year where I pointed out that 108K+ will be ATH Q1 2025 (check my TV post). It hit 110K, so pretty close. The next level was 125K, so that´s pretty close to were we are now (123K). So were are we heading now?
I might draw a new fib soon, but I see that monthly is strongly bullish. Stoch RSI is turning up from mid-range, so still has room to run. Volume hasn't spiked dramatically, so a healthy climb without blow-off. 100K looks like a resistance turned into support (also a psychological level).
Weekly is bullish with last weeks strong candle managed to breakout from that 110K level (should now be resistance level). Volume is increasing week-over-week the last weeks which confirms breakout strength. I see that if we loose 100K it could be critical (invalidation of bullish BIAS).
On daily the Stoch RSI is curling downward from overbought which might imply cooling off = short-term retrace. Price has rallied sharply and is currently pulling back slightly after tagging 123K. A pullback to 110-116K looks likely. It would be healthy and expected.

Bitcoin Wave Analysis – 16 July 2025- Bitcoin reversed from a support area
- Likely to rise to resistance level 122770.00
Bitcoin cryptocurrency recently reversed up from the support area located between the key support level 115000.00 and the support trendline of the daily up channel from June.
This support area was further strengthened by the 38.2% Fibonacci correction of the sharp upward impulse from July.
Given the clear daily uptrend and the strongly bullish sentiment seen across cryptocurrency markets today, Bitcoin cryptocurrency can be expected to rise to the next resistance level 122770.00 (top of the previous impulse wave i).

BTC/USDT Trade Update – July 16🚨 BTC/USDT Trade Update – As Planned! 🚨
Shared this setup earlier, and it’s unfolding exactly as expected. Hope you’re all locking in solid profits! 💸
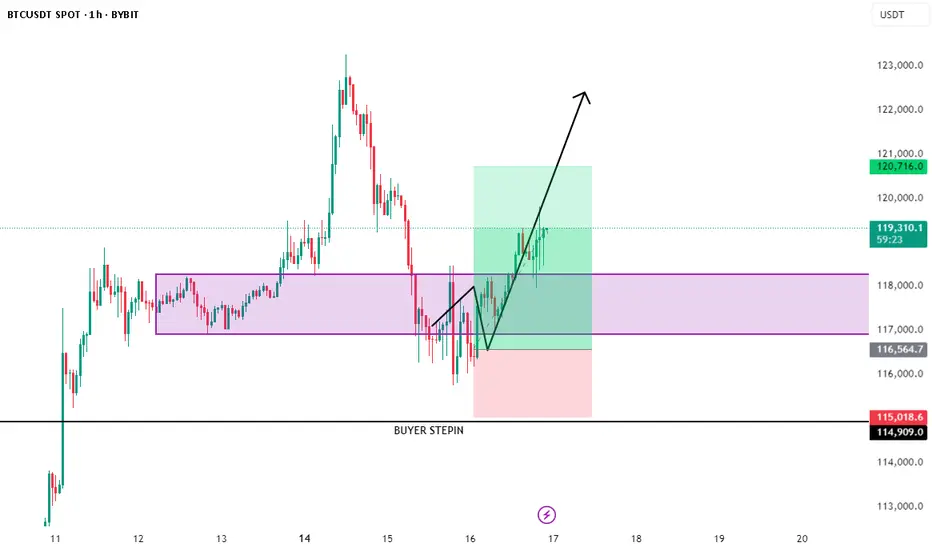
🔹 Entry: BUYER STEP‑IN zone at 116.5 K – 118 K
🔹 Confirmation: Strong bullish engulfing from demand + reclaim of 118 K
🔹 Current Price: 119 K+ and climbing
🔹 Targets Ahead: 120.7 K 🔜 122 K 📈
📌 Why it’s working:
• Demand absorption after liquidity sweep
• V‑shaped recovery forming a higher low
• Increasing momentum + follow‑through volume
🔥 Riding the wave—letting profits run!
🔔 For more real‑time setups, follow 👉 @Ali15349323
#BTC #Bitcoin #CryptoTrading #PriceAction #Profits #TradingView
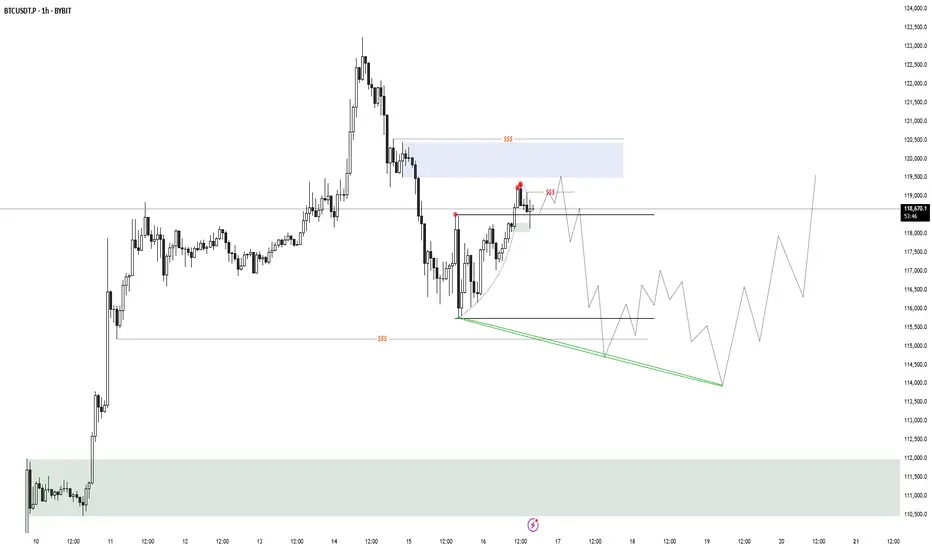
BTC 16.07.25Looking for LTF distribution to take out liquidity and create a MTF accumulation to then go higher.
Bitcoin Full analysis: Buy the dip confirmed, 123240 key__________________________________________________________________________________
Technical Overview – Summary Points
__________________________________________________________________________________
Momentum: Very bullish across all timeframes; healthy compression above previous range.
Key Supports: 115731–110481 USDT (structural, 1D to 1H).
Major Resistances: 123240 USDT (multi-frame pivot).
Volume: Normal, no climax or distribution — flows support the dominant bias.
Risk On / Risk Off Indicator: Strong bullish HLTF signal; short-term neutral intraday.
ISPD DIV: Neutral on all timeframes.
Multi-TF Behavior: Bull rally, no excess, no euphoria or capitulation; market holds above key levels.
__________________________________________________________________________________
Strategic Summary
__________________________________________________________________________________
Global Bias: Strong bullish – MT/LT “buy on dips” confirmed.
Opportunities: Progressive buying (117800, 115731 USDT), continuation on breakout >123240.
Risk Zones: Possible pullback if clear rejection below 123240, swing invalidation if close <115731-111949.
Macro Catalysts: Awaiting FOMC late July, short-term volatility limited. Watch geopolitics, extreme compression.
Action Plan: Swing entry: 118300–119000. Stop: 115500. Target: 123200 then 126000+. R/R ≥2.5. Adjust risk management before FOMC.
__________________________________________________________________________________
Multi-Timeframe Analysis
__________________________________________________________________________________
1D: Bullish momentum, supports at 105054/107939–110483. Risk On / Risk Off Indicator strong buy, healthy volume, ISPD neutral.
12H: Consolidation below 123240, aligned supports 110481/115731, healthy structure.
6H: Confirmed momentum, continuous compression, no major sell signals.
4H: Rally structure robust, corrections limited and on support.
2H: Key support band 115731–110481, volume supports rebound, possible rotation below 123240.
1H: Rally confirmed, no panic selling detected.
30min/15min: Intraday consolidation, micro-range below resistance, stable volume, Risk On / Risk Off Indicator short-term neutral.
Cross-TF summary: CLEAR momentum across all frames, no significant divergence, high-quality HTF supports. Next >123240 breakout likely fast and dynamic.
__________________________________________________________________________________
Technical & Fundamental Synthesis
__________________________________________________________________________________
Technical Synthesis: Broad bullish confirmation; buy-the-dip valid on 117800/115731, no aggressive downside signal. Swing positions above 118200 to be favored, expect acceleration after clear break of 123240.
Stops & Invalidation: Swing stops below 115731/111949. Closing below = increased risk, “off” bias.
Fundamentals: Optimal pre-FOMC swing window, US market in wait-and-see mode short term. Neutral/volatile geopolitics, no immediate shocks.
On-chain: Heavy accumulation, historic compression, ETF flows strong (but on short pause). Imminent volatility squeeze possible either way.
Recommendation: Actively monitor 123240 (breakout above), 115731 (below = increased caution). Adjust stops and sizing, remain highly responsive, especially as FOMC approaches.
__________________________________________________________________________________

Bitcoin Ranges While Altcoins Rise — Follow the Liquidity TrailHeyy traders, it’s Skeptic from Skeptic Lab! 💙 Dropping a red-hot update on Bitcoin and the crypto market to catch the next big wave. We’re diving into the Daily timeframe and market dynamics to track where the money’s flowing. here’s the play:
✔️ Daily Timeframe
As we flagged in my last Bitcoin chart, the $ 120,000 level is a liquidity magnet with heavy action. The July 14 candle tried breaking it but failed, leaving a downward shadow showing strong seller presence at this level. Plus, last week we hit the 4-week pivot point on the Weekly , and as expected, we’re now ranging around $120,000. Does this mean we ditch crypto? Big NO.
📊 Bitcoin Dominance (BTC.D)
Let’s zoom in on BTC.D —it’s gone sharply bearish, with yesterday’s candle screaming capital exiting Bitcoin. Traders who profited up to $120,000 are locking in gains and moving funds elsewhere. So, what’s the story?
Bitcoin broke its ceiling after 168 days, surging 10% to $122,000. Buyers took profits, pulling liquidity out.
Where’s the money going? Let’s test two theories:
USDT? Nope. USDT.D is also bearish.
Altcoins? Bingo! TOTAL2 (altcoin market cap) smashed its Daily resistance at 1.34 after months, signaling liquidity flooding into altcoins.
📉 Which Altcoins? Here’s the trick: check pair/BTC ratios . For example, to pick between Solana or Ethereum, compare S OL/BTC and ETH/BTC . The one with a stronger uptrend is soaking up more liquidity from Bitcoin.
🔔 Key Insight: This liquidity flow game is a game-changer for crypto traders. Want a full dominance tutorial? Let me know —it’ll show you how to track where the money moves and which coins get the most action.
🔼 Key Takeaway: Bitcoin’s ranging at $120,000, but altcoins are heating up as BTC.D drops. Hunt for altcoins with bullish pair/BTC charts to ride the liquidity wave. Risk management is your lifeline—cap risk at max 1%–2%. I’ll catch you in the next analysis—good luck, fam! <3
💬 Let’s Talk!
Which altcoin are you eyeing? Hit the comments, and let’s crush it together! 😊 If this update lit your fire, smash that boost—it fuels my mission! ✌️

Where Is BTC Headed in the Next 7 Days?As Bitcoin (BTC) continues to dominate headlines, investors and traders are eager to understand its next move. With a current price of around $117,465 and a recent all-time high (ATH) of $122,980 on July 14, 2025, the cryptocurrency market is buzzing with excitement. Drawing from real-time data on social media platforms like X, web sources, and technical analysis, this article explores Bitcoin’s potential market direction over the next seven days, blending fundamental and sentiment insights for a comprehensive outlook. Whether you're a seasoned trader or a curious HODLer, here’s what you need to know about Bitcoin’s short-term trajectory.
Bitcoin’s Current Market Landscape
Bitcoin boasts a market capitalization of $2.34 trillion and a 24-hour trading volume of $88.63 billion as of July 16, 2025. Its market dominance stands at 62.92%, though it dipped slightly by 0.54% recently, hinting at competition from altcoins. The market is driven by strong fundamentals, including institutional adoption and supply constraints, but short-term volatility looms as traders monitor key price levels. Let’s break down the factors shaping Bitcoin’s path and forecast its movement through July 23, 2025.
Fundamental Factors Driving Bitcoin’s Momentum
Over 265 companies hold Bitcoin, with portfolios valued in the billions. Spot Bitcoin exchange-traded funds (ETFs) recorded $1.69 billion in inflows this week, reflecting strong institutional confidence in Bitcoin as a store of value.
The April 2024 halving reduced miner rewards, tightening supply—a pattern that has historically fueled bullish cycles. Analysts predict sustained upward pressure as demand grows against a constrained supply.
Bitcoin’s correlation with risk assets like the S&P 500 (0.73–0.90 in Q2 2025) underscores its role as a hedge against inflation and geopolitical uncertainty, amplified by recent U.S. policy shifts favoring crypto.
Over 95% of Bitcoin addresses are in profit, and declining exchange reserves suggest long-term holders are confident in higher prices, reducing available supply.
However, risks like profit-taking after the recent high and macroeconomic uncertainties, such as trade tensions, could introduce short-term fluctuations. These fundamentals set the stage for Bitcoin’s next moves.
Sentiment Analysis. Gauging the Market’s Mood
Market sentiment, gathered from online discussions and news, leans bullish with some cautionary undertones.
Recent analysis indicates that bearish sentiment often signals market bottoms, suggesting a potential bullish reversal. Whale accumulation amid retail uncertainty further supports optimism. Bitcoin’s sentiment score averages 82/100, with 45.49% bullish, 11.49% bearish, and 54.51% neutral commentary, reflecting high engagement.
Institutional enthusiasm, ETF inflows, and pro-crypto policy developments drive positive sentiment, particularly in the U.S. and Europe. However, concerns about price manipulation—evidenced by a +1,550% surge in related online searches—and potential profit-taking temper short-term optimism.
High trading activity during European hours (08:00–17:00 GMT) often extends Asian session trends, while weekends see increased volatility due to lower institutional participation.
The overall sentiment is bullish, with short-term bearish signals potentially creating buying opportunities for savvy investors.
Technical Analysis
Technical analysis across 15-minute (15m), 1-hour (H1), and 4-hour (H4) time frames offers insights into Bitcoin’s short-term behavior
15m and H1 Time Frames: Recent chart patterns show a rejection below $117,800, indicating a short-term bearish structure. Support lies at $115,000–$116,600, with resistance at $117,800–$118,000. Indicators like the Relative Strength Index (RSI at 68) and MACD suggest neutral momentum, with a bearish bias if Bitcoin remains below $118,000. A break below $115,000 could push prices toward $109,000–$110,000.
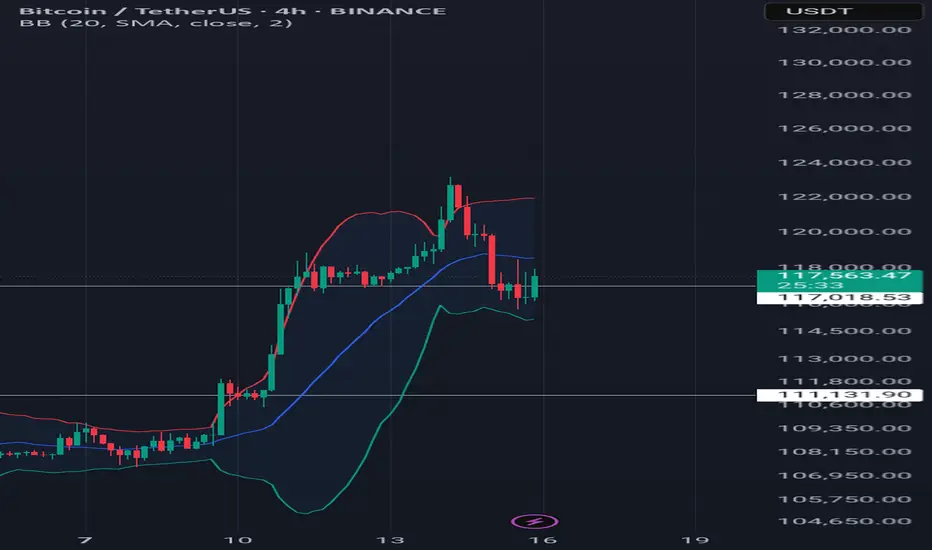
H4 Time Frame: The market is consolidating, with the 9-period Exponential Moving Average (EMA) catching up to price. The long-term trend remains bullish, supported by rising 50-day and 200-day moving averages. Overall, technical indicators rate Bitcoin as a “Buy,” with 13 Buy signals from moving averages and neutral oscillators, pointing to a potential retest of $120,000–$123,000 if support holds.
The charts suggest a bullish long-term trend with short-term consolidation, making support levels critical for traders.
Bitcoin Price Forecast for Next 7 Days
Synthesizing fundamental strength, sentiment trends, and technical signals, here’s Bitcoin’s likely direction by July 23, 2025
Bullish Scenario: If Bitcoin holds above the $115,000–$116,000 support zone, it could rally to $120,000–$123,000, fueled by institutional demand, ETF inflows, and positive sentiment. Rising moving averages and a bullish H4 trend support this, with analysts eyeing even higher long-term targets. A breakout above $118,000 could trigger a push toward the recent high or beyond.
Bearish Scenario: Short-term bearish signals on 15m and H1 time frames, combined with profit-taking risks, suggest a potential dip to $115,000–$116,000. A break below could target $109,000–$110,000, particularly if macroeconomic concerns or altcoin competition intensify.
Bitcoin may test $115,000–$116,000 in the next few days due to short-term bearish pressures, but strong fundamentals and bullish sentiment make a rebound to $120,000–$123,000 likely by July 23, 2025. Any pullback should be viewed as a buying opportunity, given the robust institutional and on-chain metrics.
Key Levels to Watch
Support: $115,000–$116,600 (short-term), $109,000–$110,000 (secondary)
Resistance: $117,800–$118,000 (immediate), $120,000–$123,000 (next target)
Catalysts: Keep an eye on ETF flows, macroeconomic developments (e.g., inflation, trade policies), and online sentiment for potential market shifts.
Bitcoin’s market is in a dynamic phase, balancing short-term volatility with a strong bullish foundation. Traders should monitor the $115,000–$116,000 support zone for signs of a bounce or further correction, while long-term investors can take comfort in the robust fundamentals driving Bitcoin’s growth. The next seven days could see BTC testing $120,000–$123,000 if key levels hold, though a brief dip is possible. Stay informed on market developments and be ready to seize opportunities in this exciting crypto landscape.
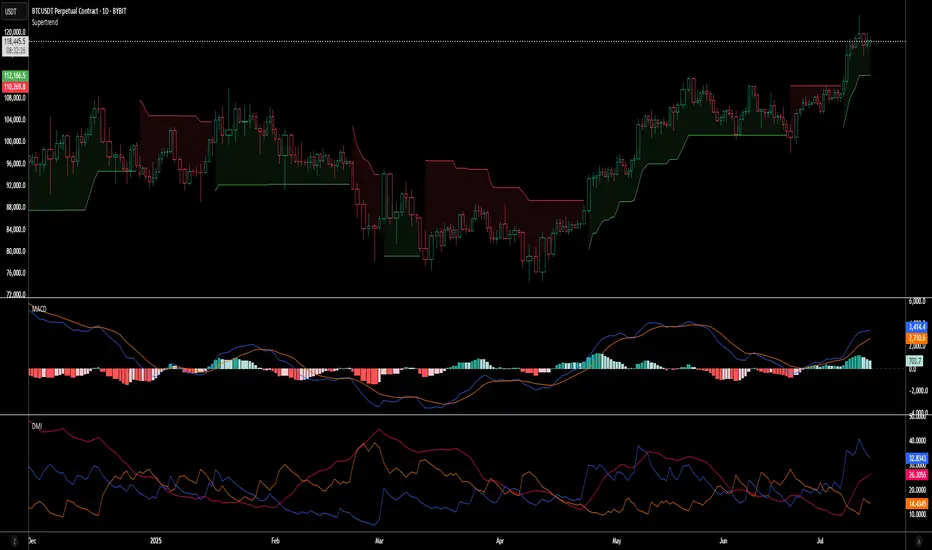
Volume Spread Analysis (VSA) reflects increasing selling!🚨 Bitcoin Market Update 🚨
Bitcoin recently hit an All-Time High (ATH) but is now experiencing a downward correction. Multiple technical indicators suggest continued bearish momentum:
📉 Volume Spread Analysis (VSA) reflects increasing selling pressure.
📊 A bearish engulfing pattern confirms the market is trending lower.
📕 The synthetic order book reveals a heavy concentration of sell orders.
📈 The 50 & 100 SMA are acting as strong resistance levels, keeping price action suppressed below them.
🔍 Key Watch Level: If BTC breaks above the 50 SMA, we could see a potential pump. However, as of now, all confirmations point toward a bearish continuation.
💡 DYOR – Do Your Own Research
🛑 Not Financial Advice

BTC Price Prediction and Elliott Wave AnalysisHello friends,
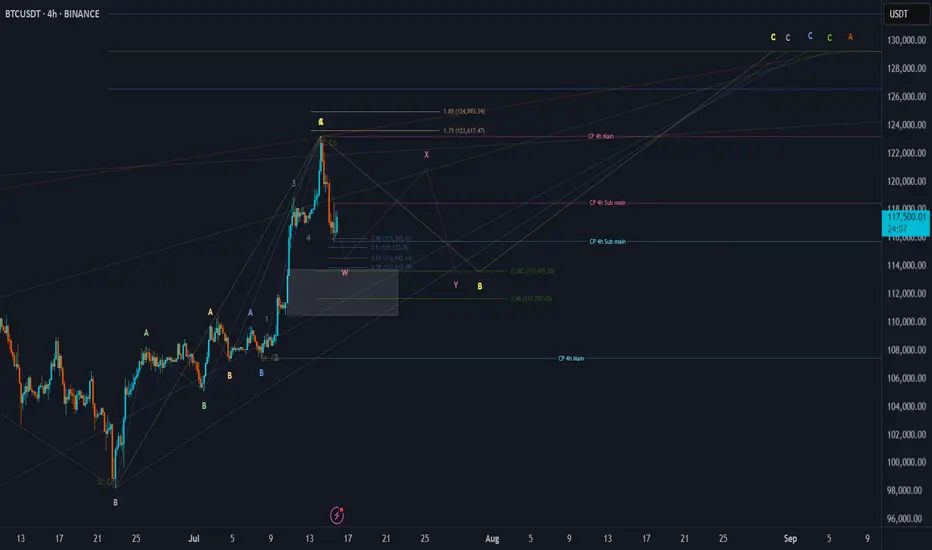
>> Thank you for joining me in my analysis. I think we have started the Yellow wave B as a micro correction. In my opinion, we will watch three waves wxy as in pink color, or it will extend to be an Irregular flat pattern where x will cross 123250
>> Till now, I am waiting to cross 118500 and stay above it after crossing for double the same time frame (my strategy).
keep like and support me to continue, See you soon!
Thanks, Bros
Bitcoin Next Breakout Pump?So far the $117k support seem to have held which is good news for the bulls. Now we should anticipate a reclaim of the $120Ks; this should form a pretty good double bottom for CRYPTOCAP:BTC to surge to $130Ks and more, of course.
BTCshort term sell positionDuring the retracement phase, there’s a good opportunity to take a short position
